Wednesday, November 16, 2022

New Relic Monitoring for Sitecore Docker Environment

 This is a copy of my blog post originally posted here to keep all things in one place.

Containerization and division of monolith to services bring many good things. For example, it makes your system distributed, which decreases coupling and makes your architecture more scalable. But some things become more complex. It is harder to monitor, debug, and trace distributed systems. There are many different systems to address this challenge:
 Prometheus, New Relic, Jaeger, etc. I decided to try New Relic. I had some experience with it in a non-containerized environment and I liked it. It has plenty of agents for different services. It has a free plan that allows playing with it even locally for free. But it isn’t necessarily the best choice. If you want to know why read this article to the end.

An example I will take Sitecore 10.2 that consists of the next services: CM(CD), Next.js rendering host, Identity Server, Horizon, MS SQL, and Solr.

CM/CD

Enabling New Relic monitoring for CM/CD containers is the most straightforward.

You will need to modify your Dockerfile:

# Download the New Relic .NET agent installer
RUN [Net.ServicePointManager]::SecurityProtocol = [Net.SecurityProtocolType]::Tls12;`
 Invoke-WebRequest "https://download.newrelic.com/dot_net_agent/latest_release/NewRelicDotNetAgent_x64.msi"`
 -UseBasicParsing -OutFile "NewRelicDotNetAgent_x64.msi"

# Install the New Relic .NET agent
RUN Start-Process -Wait -FilePath msiexec -ArgumentList /i, "NewRelicDotNetAgent_x64.msi", /qn

# Remove the New Relic .NET agent installer
RUN Remove-Item "NewRelicDotNetAgent_x64.msi"

And pass the environment variable in your docker-compose.yml:

cm:
    ...
    environment:
      NEW_RELIC_APP_NAME: CM
      NEW_RELIC_LICENSE_KEY: ${NEW_RELIC_LICENSE_KEY}
      NEW_RELIC_ENABLED: ${NEW_RELIC_ENABLED}	

It is quite convenient that New Relic has the ability to enable/disable monitoring using an environment variable. You can have the New Relic configuration present in your source control and enable it only when you need it.

Next.js Rendering Host

Next.js server runs by Node.js. We need to install New Relic NPM packages:

npm install newrelic @newrelic/next

and add @newrelic/next middleware using Node.js -r option to docker-compose.yml:

rendering:
    ...
    environment:
      NODE_OPTIONS: "-r @newrelic/next"
      NEW_RELIC_APP_NAME: "Rendering Host - Next.js"
      NEW_RELIC_LICENSE_KEY: ${NEW_RELIC_LICENSE_KEY}
      NEW_RELIC_ENABLED: ${NEW_RELIC_ENABLED}

If you will host your Next.js on Vercel, it will be even more simple. You will get monitoring in place in just a few clicks by connecting one SaaS to another.

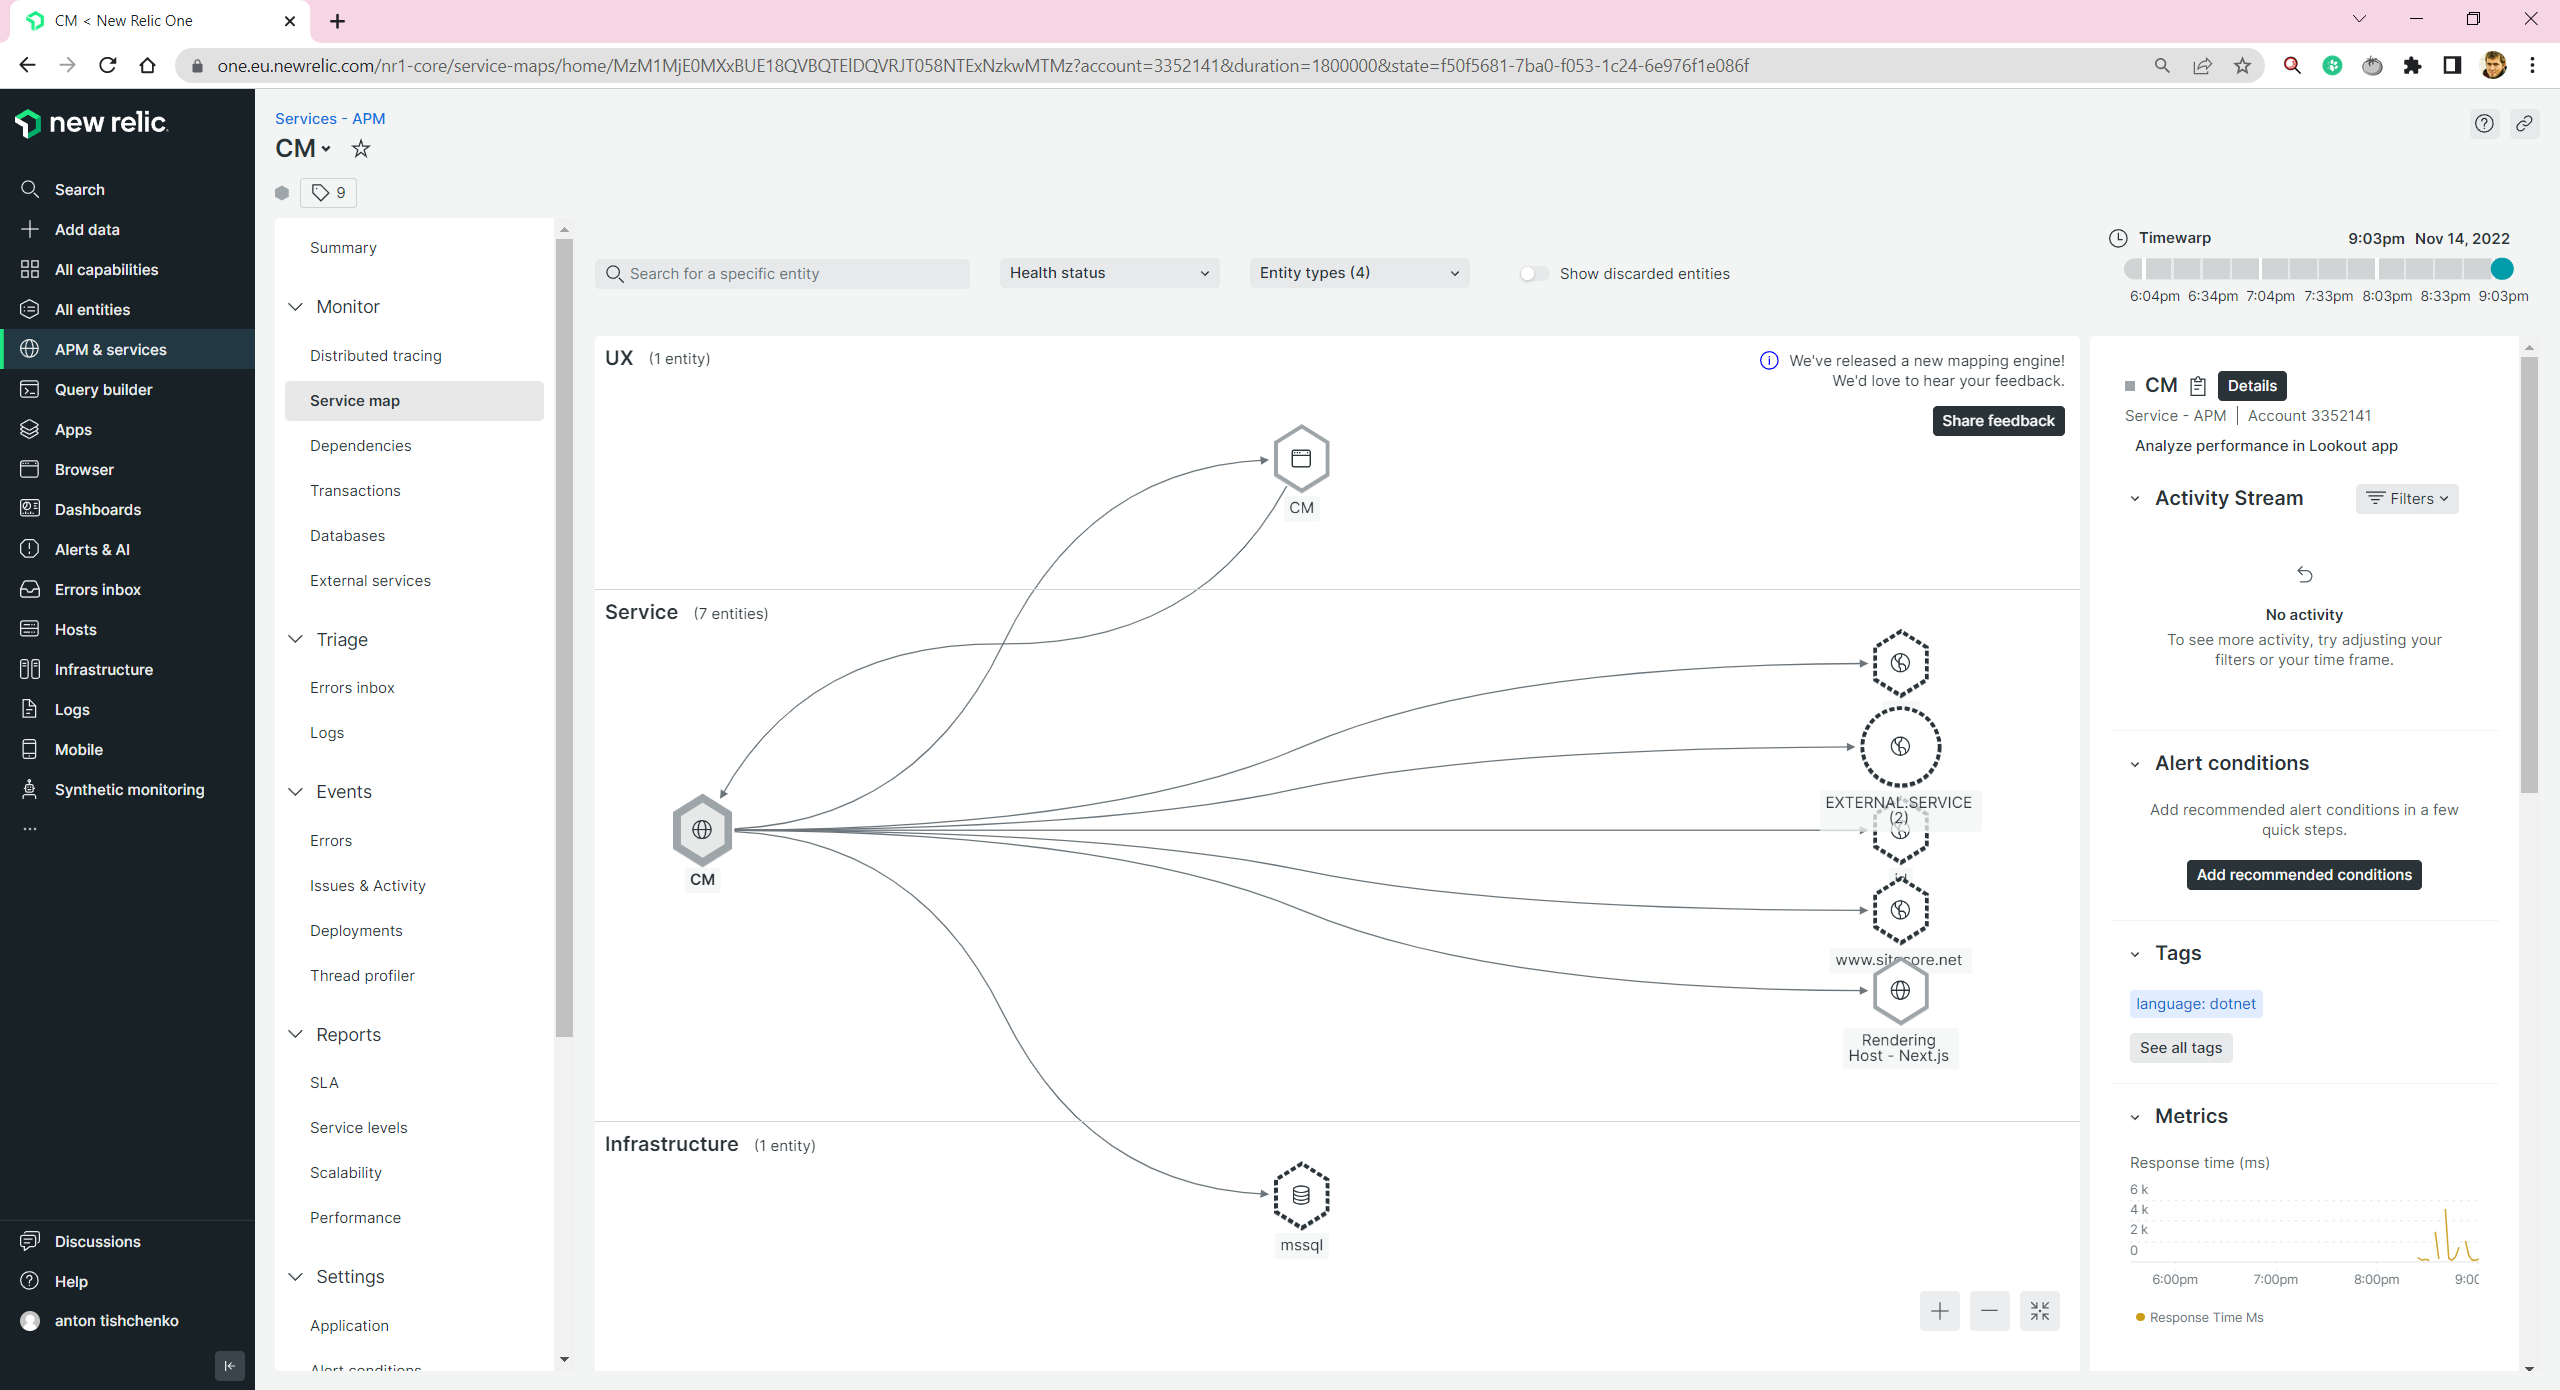
Let’s check what we get. We have a nice service map. We can see what depends on what.

Dependencies

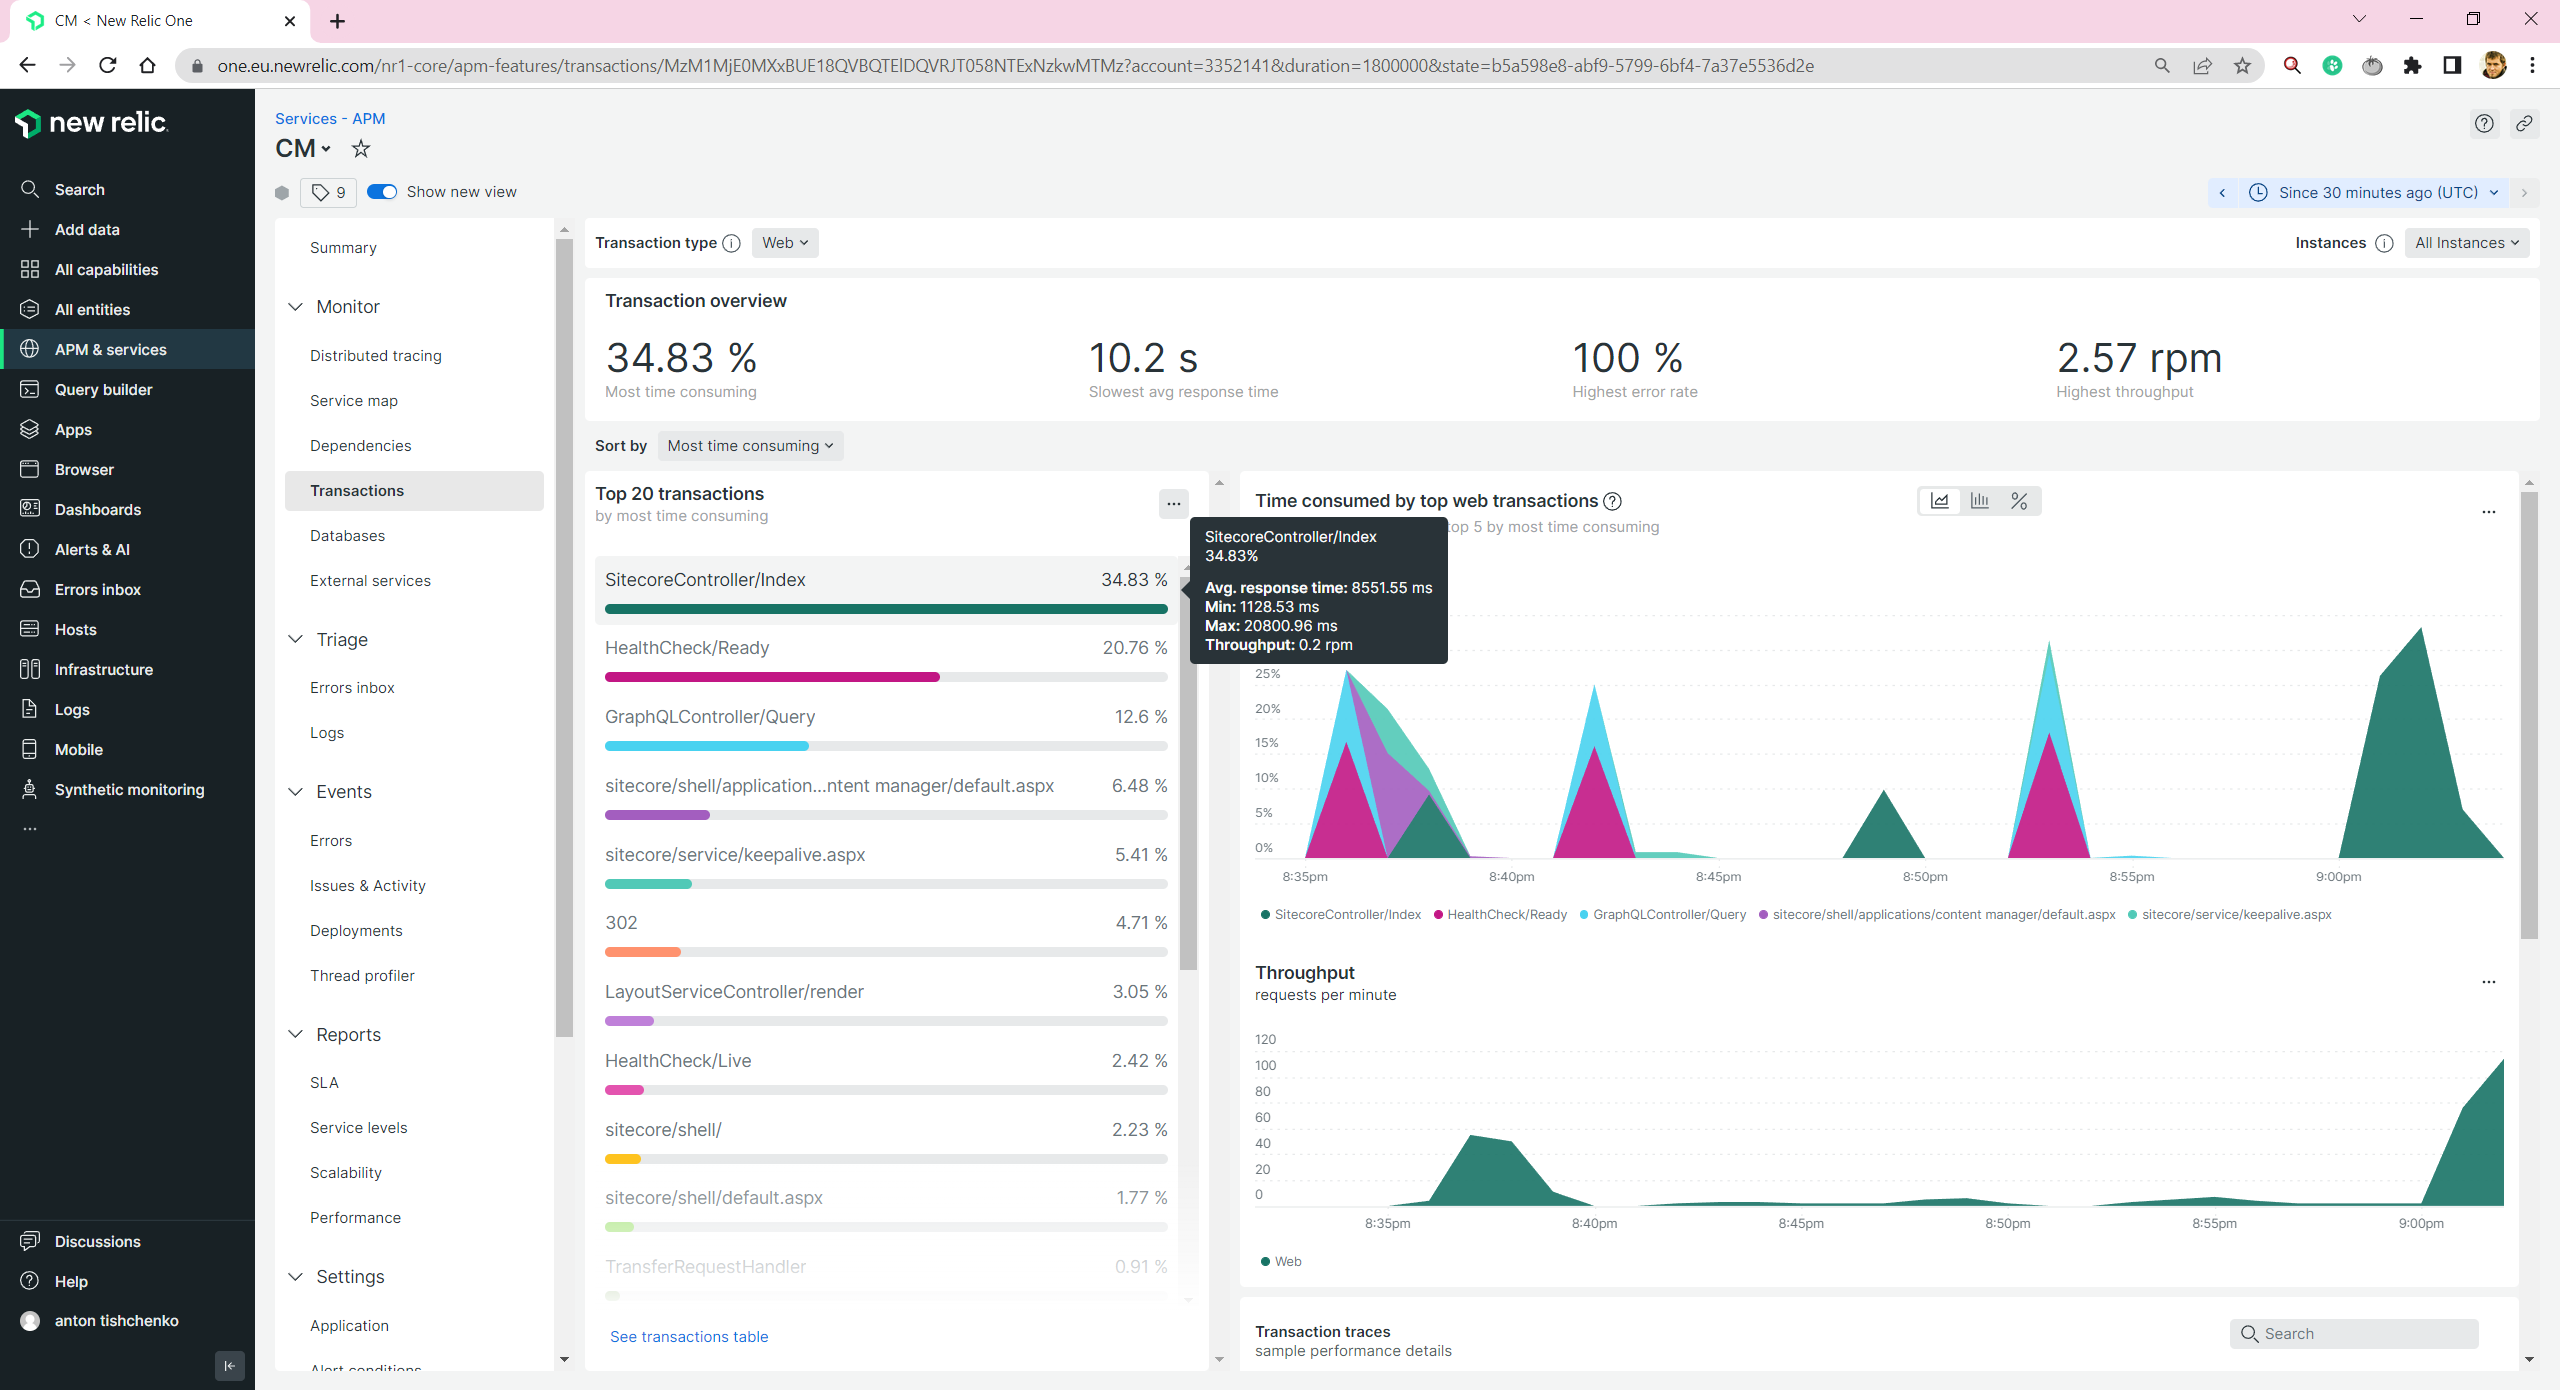
We are able to see all transactions for CM/CD/Next.js Rendering Host

Transactions

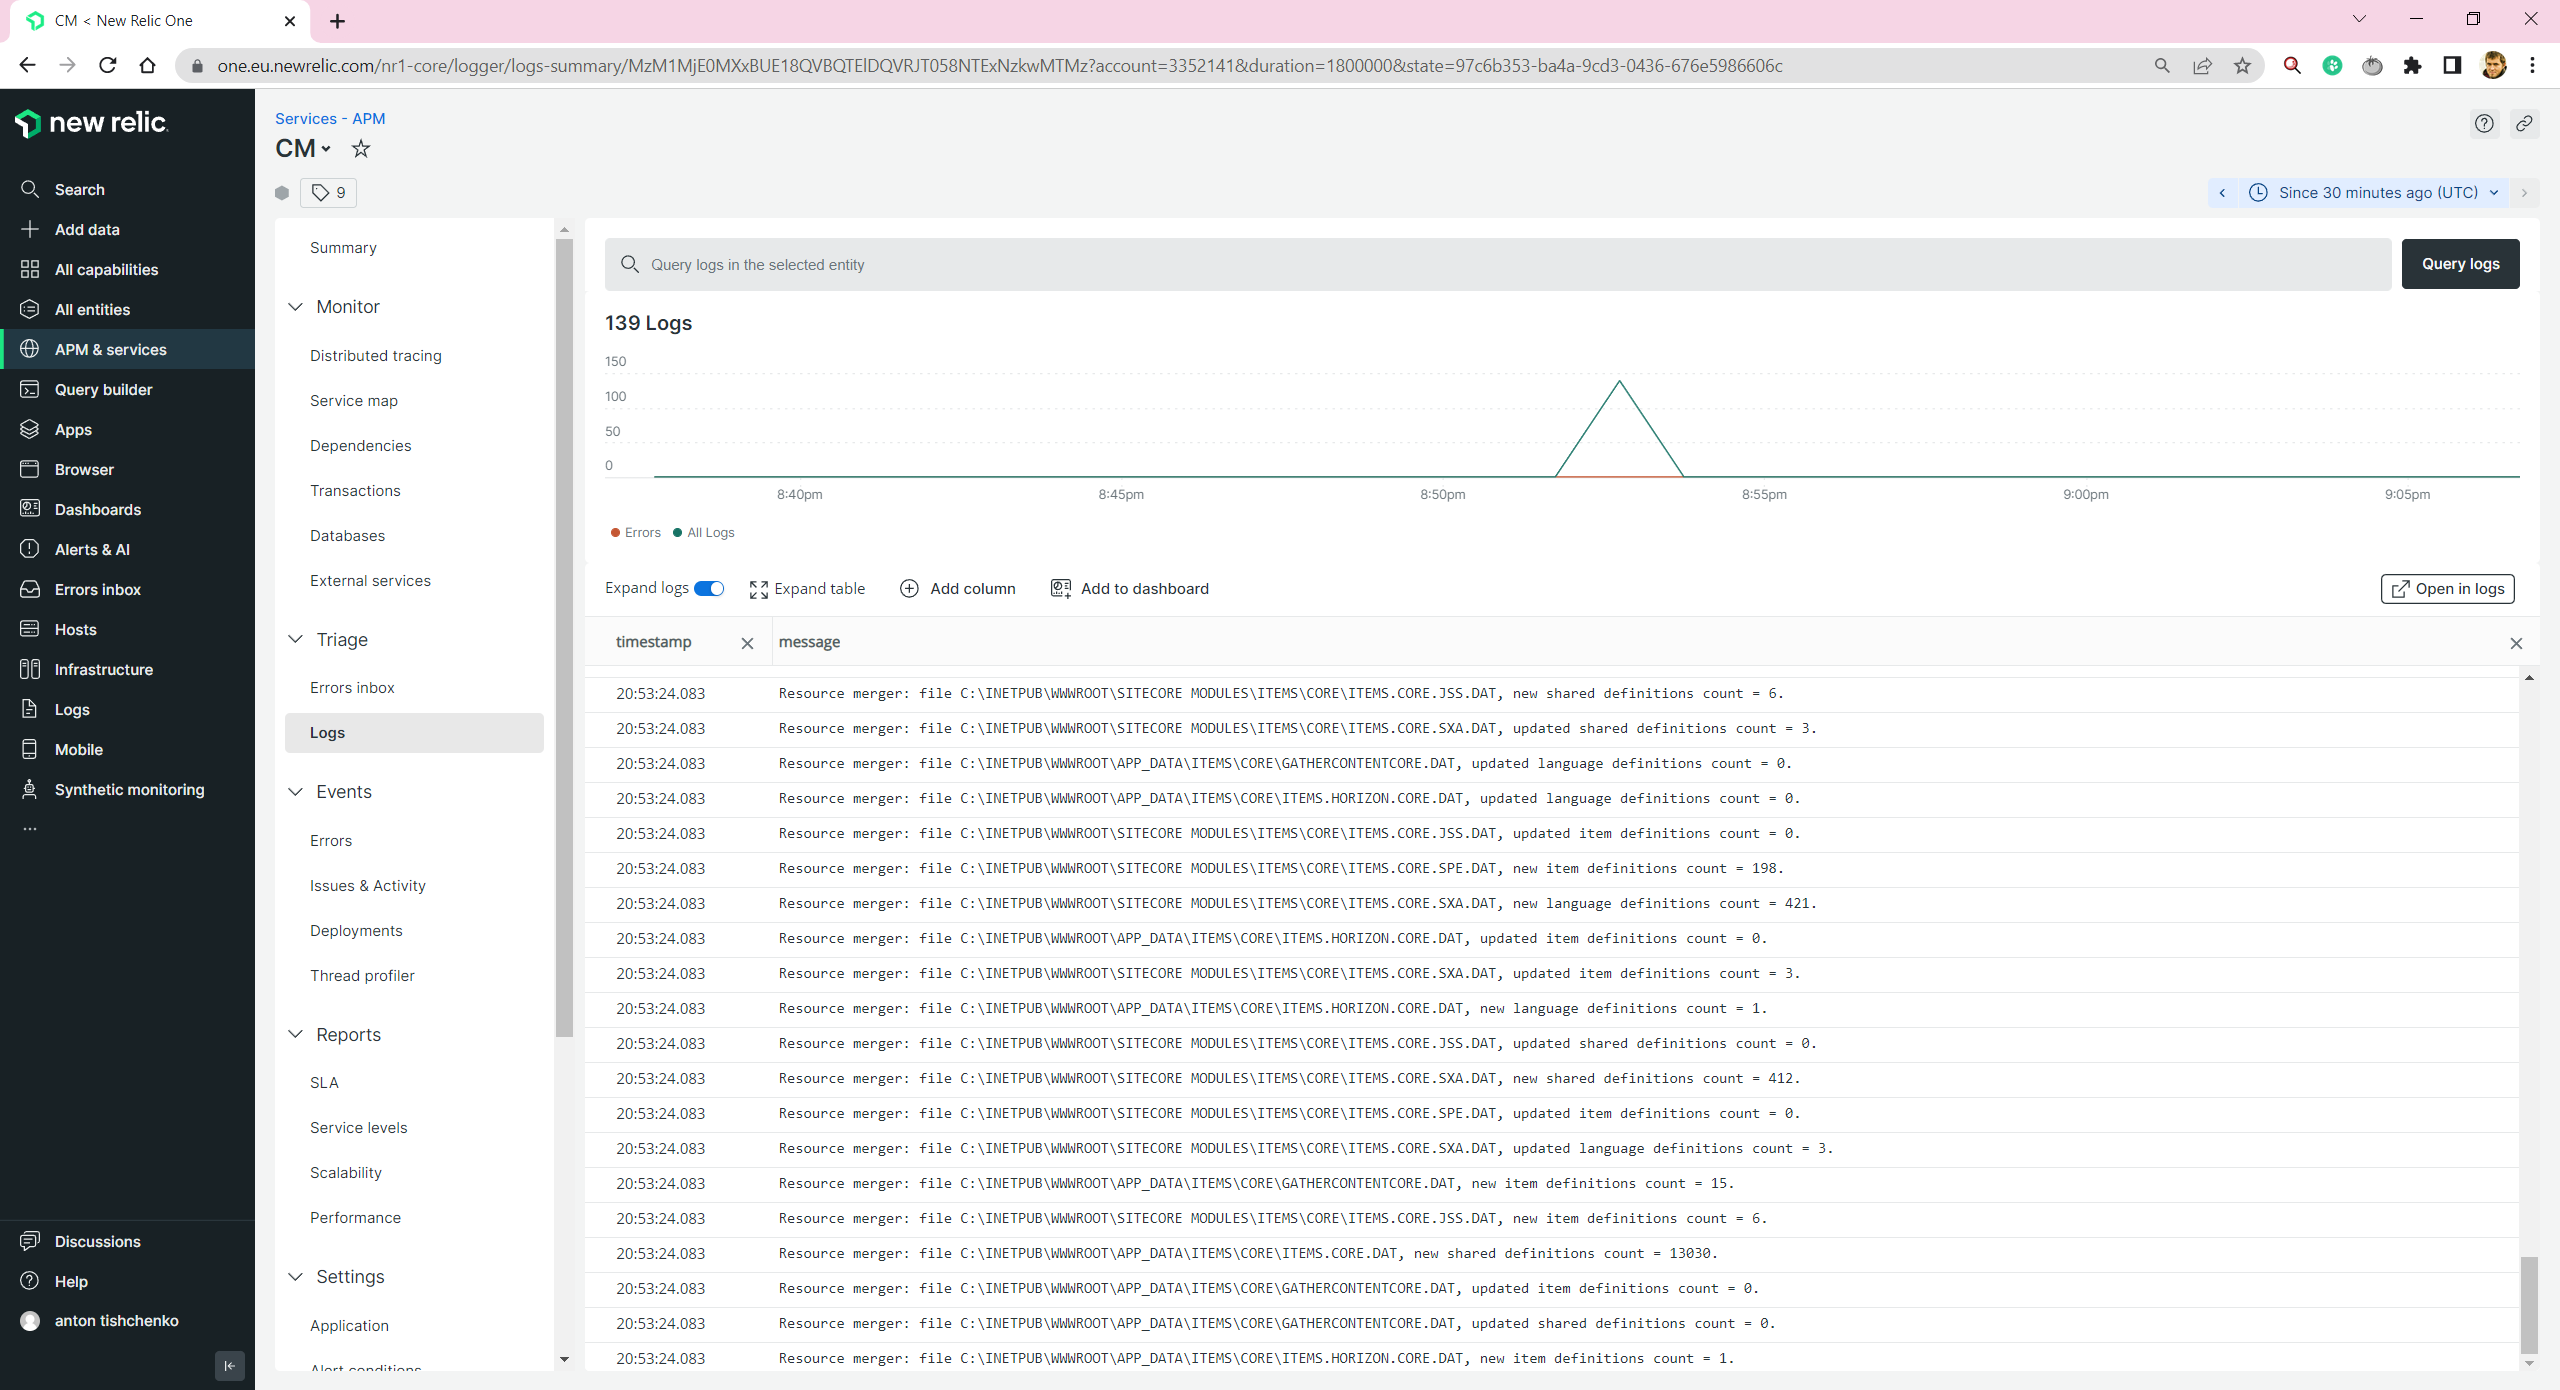
We are able to see Sitecore and Next.js logs:

Logging

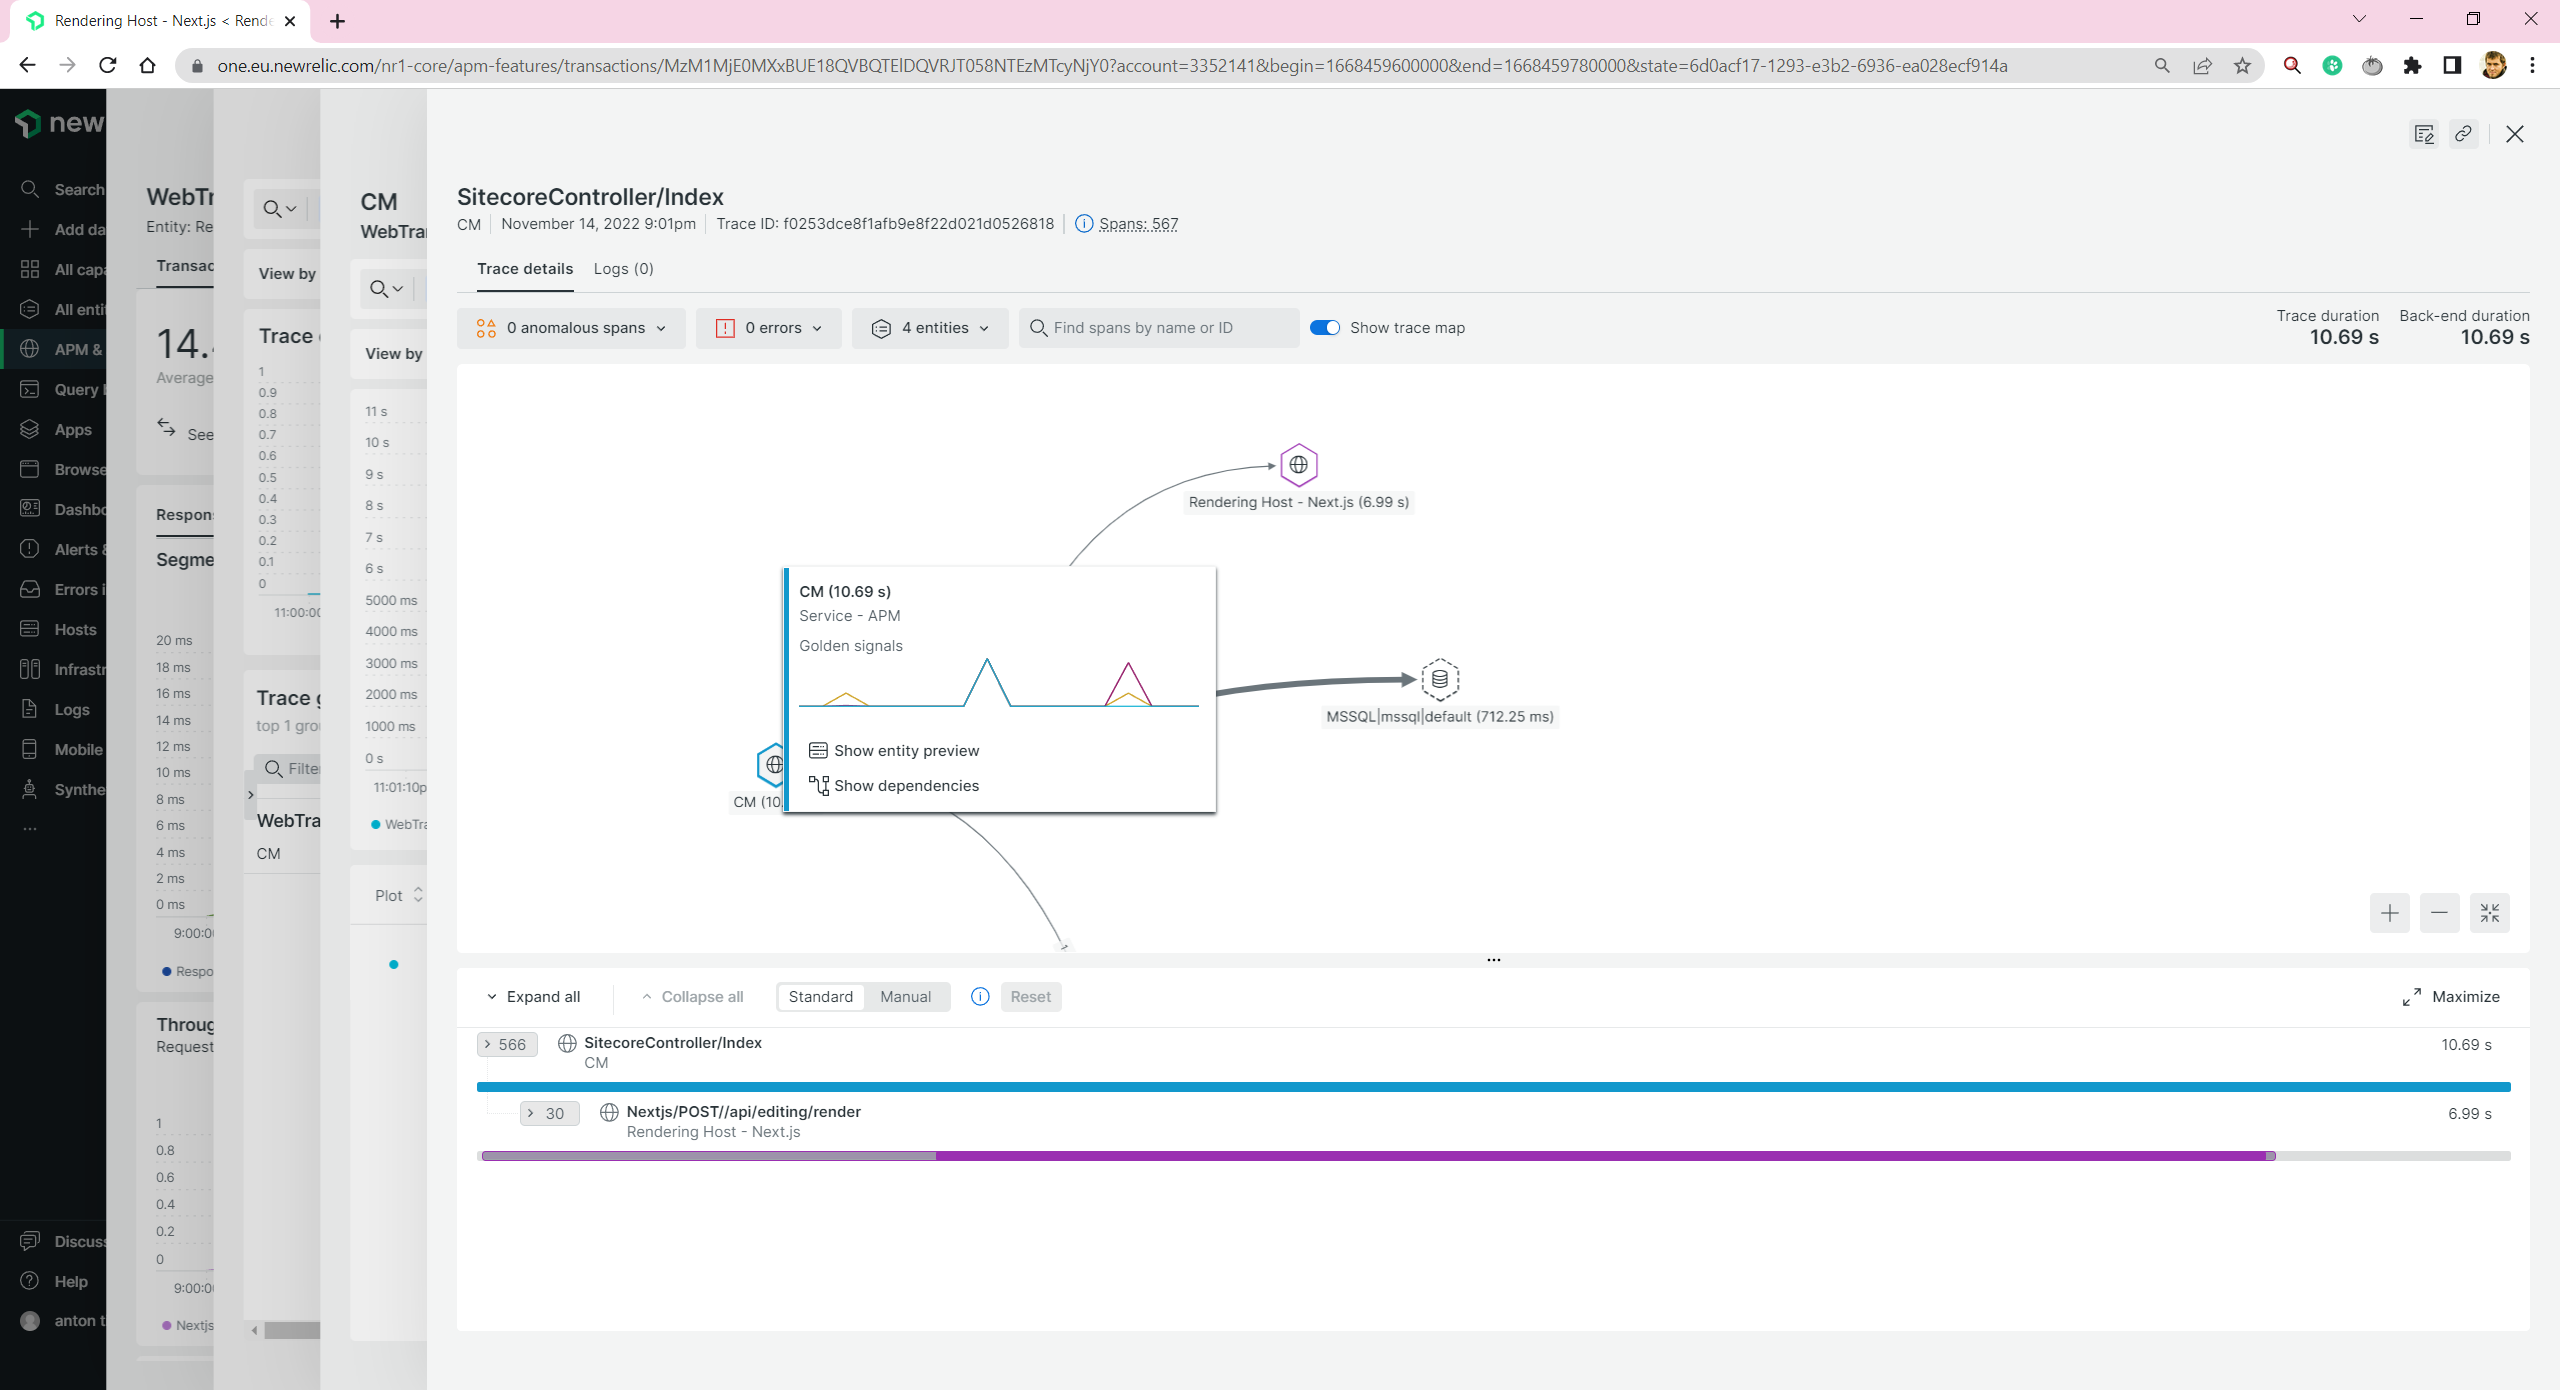
And we are able to trace distributed transactions. E.g. for Experience Editor, when both CM and Next.js rendering host take part:

Distributed transaction

Let’s go further and try to add monitoring to other services.

Identity Server and Horizon

Here I get the first problem. Sitecore Docker images for Identity Server and Horizon are based on Nano Server. And New Relic doesn’t support it. It is not a big deal. These services are not the most loaded. And monitoring them is not essential. If you need to monitor them then it still should be possible. You need to build your own containers based on Server Core or Windows base images. It is not very convenient, you will need to support these images, and rebuild during Sitecore upgrades, but still possible.

MS SQL

Here I get another problem. Sitecore Docker image should support it, I haven’t found anything in the requirements that don’t match. And I tried a few different methods of agent installation: guided(you need to run PowerShell scripts) and manual(you copy files and create a Windows service). But both cases failed, and I got a message unsupported. Is it a big deal? Most probably - not. For production environment you will host your databases either on Azure SQL Databases or on Amazon RDS. And these agents work just fine. But, unfortunately, no monitoring locally.

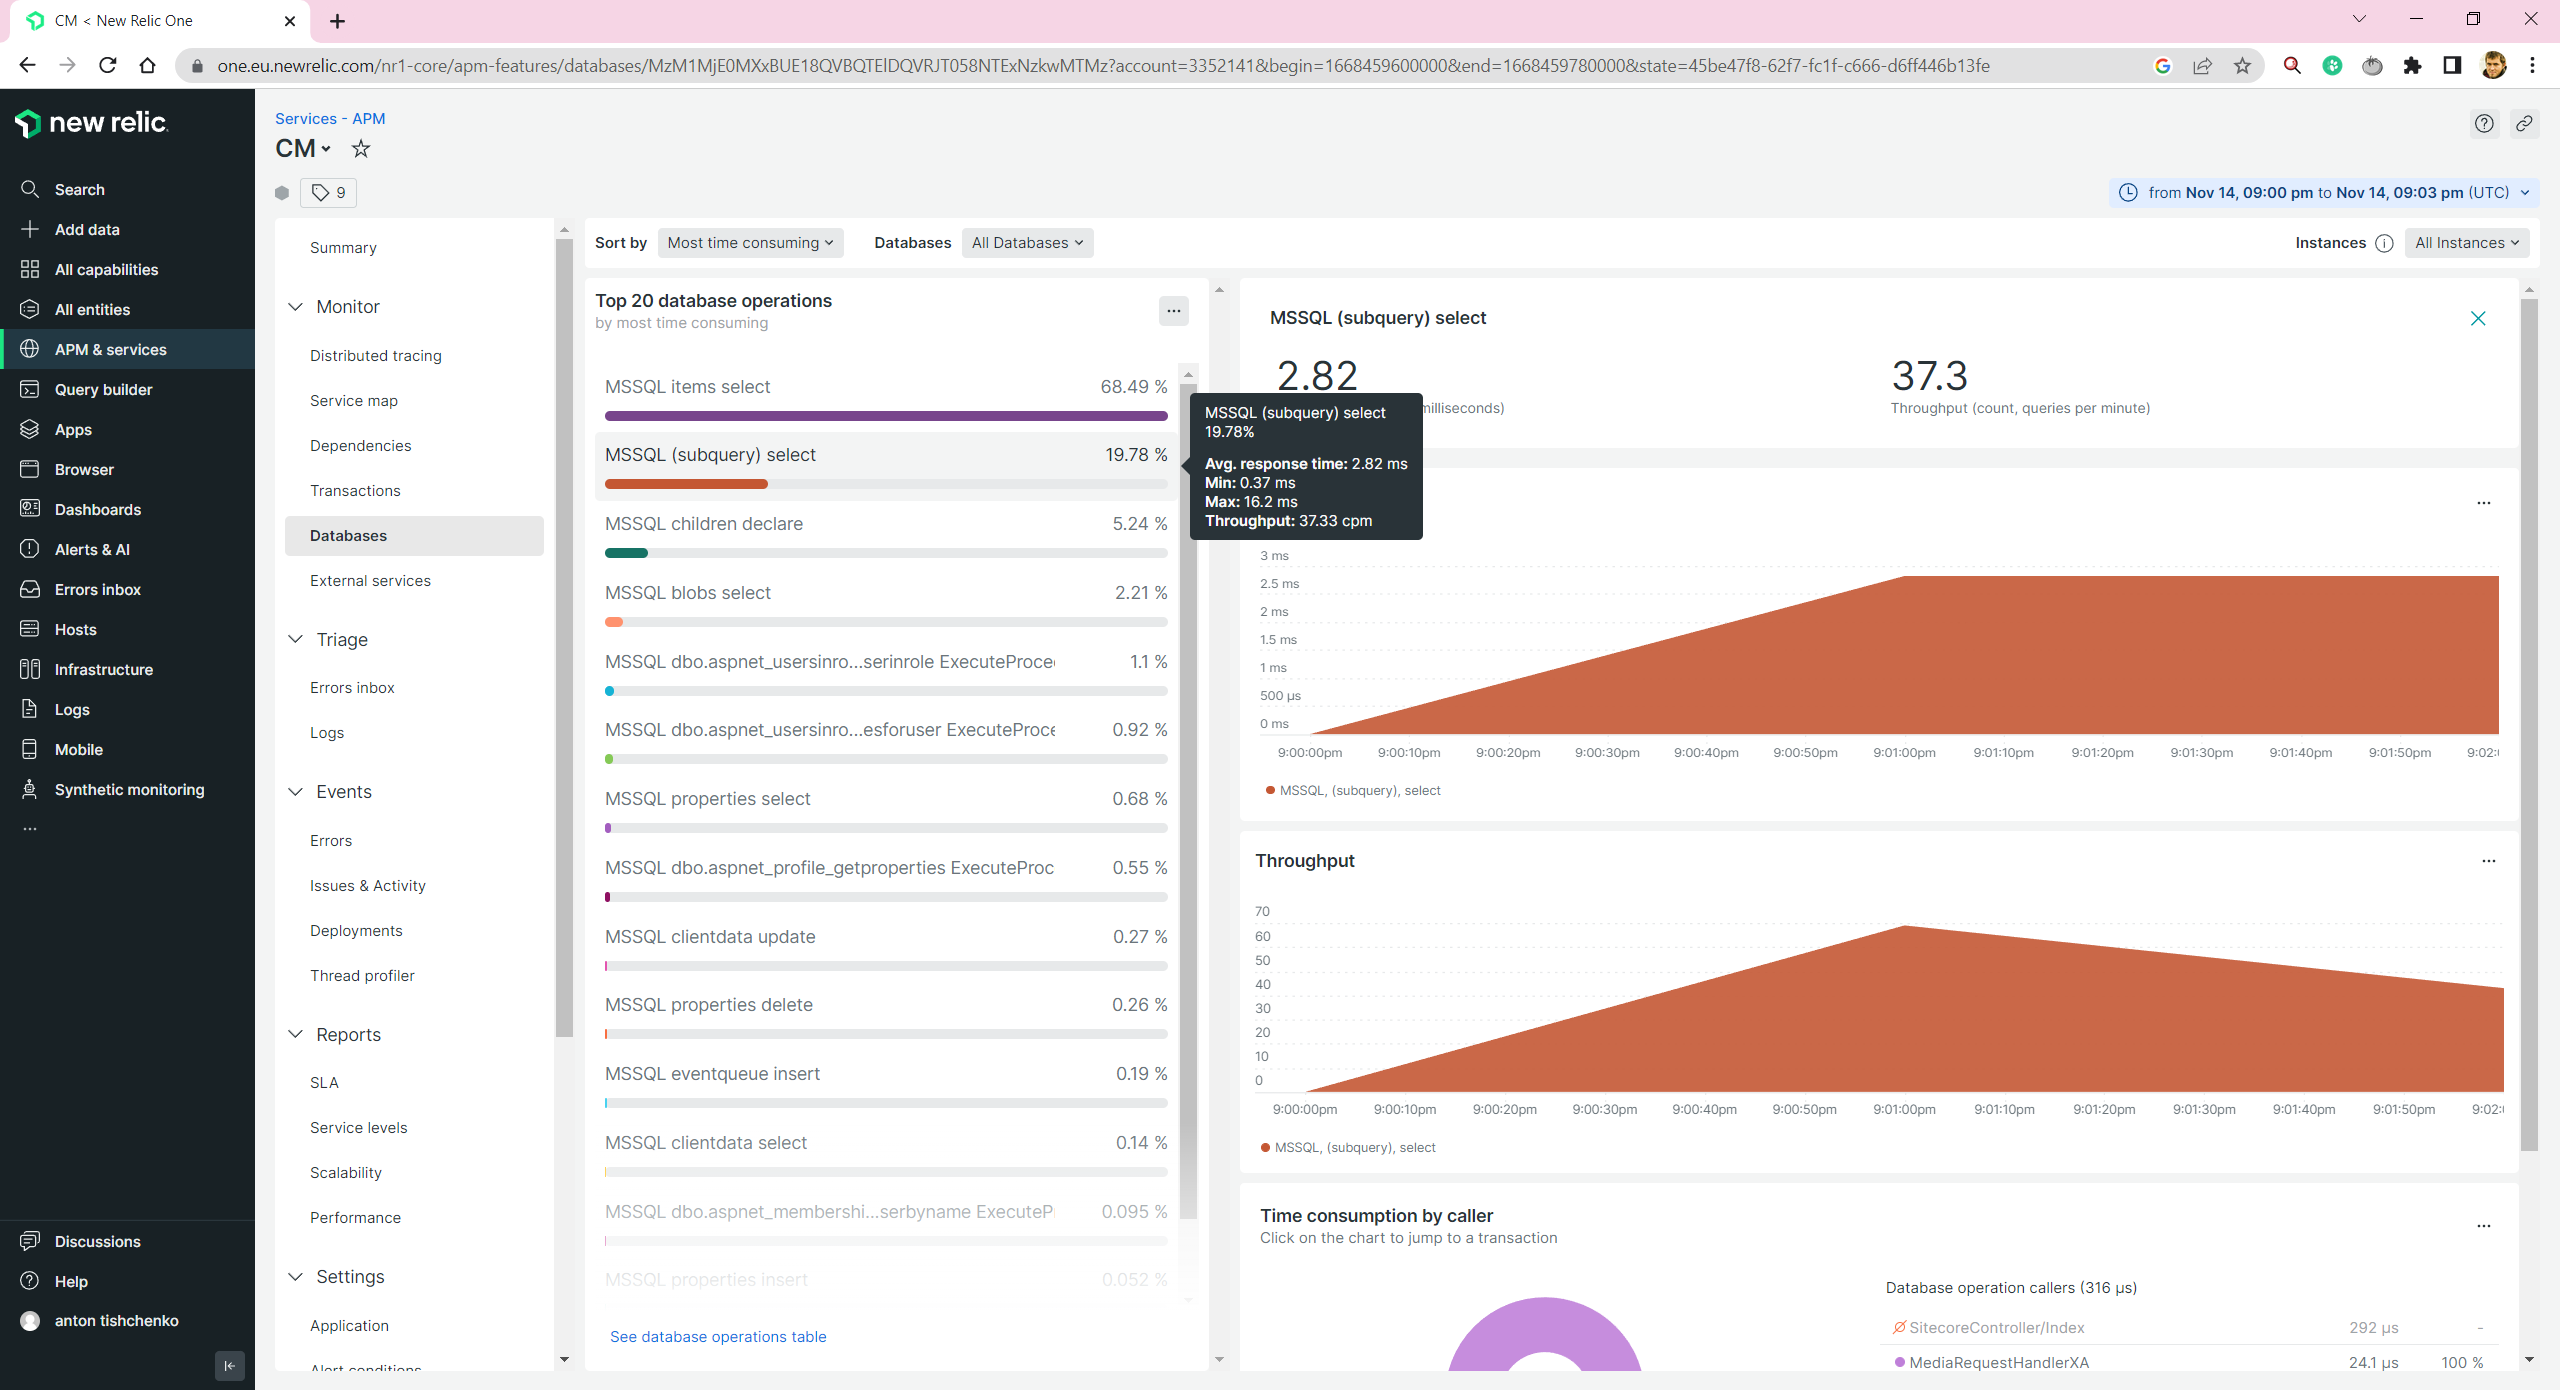
You still will be able to get some database insights by reviewing your CM/CD monitoring information. But they are not as detailed as they can be.

SQL Metrics

Solr

In fact, Solr is a Java server wrapper on Lucene. And as it is based on Java, we should follow Java instructions. We need to download and add into Solr image newrelic.jar, a Java-based New Relic agent, and modify solr.cmd to run Java with an agent -javaagent:newrelic.jar. And pass New Relic environment variables similar to other services.

Conclusion

Is New Relic a good tool for monitoring your Sitecore containers? Despite some difficulties with MS SQL, Horizon, and Identity server, I will answer - yes. You will be able to get New Relic monitoring for your major Sitecore services in place in one SCRUM team sprint. During the second sprint, you will be able to add some additional metrics. There is a worse situation with other free open-source competitors. You will get software for free, but you will spend more time configuring and supporting it.

Saturday, November 12, 2022

Traefik Dashboard and Access Logs in Sitecore Docker Configuration

This is a copy of my blog post originally posted here to keep all things in one place.

 Sitecore Docker Containers are already widely used for a few years. I have seen many different configurations on different projects. All of them could be divided into 2 groups: with reverse proxy and without reverse proxy. You can live without reverse proxy and traffic orchestration if you have only CM and CD. But things become complex when you have other services: Identity Server, Horizon, etc. And it is much easier to get everything to work with a reverse proxy.

And all the times, when I saw Sitecore Docker setup was with a reverse proxy, it was Traefik. Indeed, it can be any other reverse proxy: nginxreproxy. But all the time it was Traefik. I think there are 2 reasons, why it is so. First, is that Traefik has a Windows Docker image. And we don’t need to run Windows and Linux containers simultaneously. The second reason is that Sitecore Docker examples were provided with Traefik. And that is a similar story to how gulp became so popular in the Sitecore world. If you have a working example, why do you need to reinvent the wheel?

Now, let’s talk about 2 Traefik features that could be useful for better understanding what is going on with your Traefik container.

Dashboard

Traefik has a dashboard. You may find a port for it in your docker-compose.yml file.

services:
  traefik:
	...
    ports:
      - "8079:8080"

It means that http://localhost:8079/ in my case will be an URL to the dashboard.

Traefik Dashboard

It is not very useful if everything is working. You will get just green circles. But if there is something wrong, it is the right place to identify what. And it can give you a clue: what is wrong and what you need to fix or reconfigure.

Access logs

When you run Docker for MVC/SXA solution, you can find all access logs that you need in your CM/CD Docker container under C:\intetpub\logs\logfiles\w3svc1 . It is the usual IIS logs location. When you run a headless setup, you don’t have access logs to your rendering host, but you can configure Traefik to get it.

You need to add 2 parameters accesslog to enable logging and accesslog.filePath to setup the path to log file inside your container. And also you can map Docker volume in order to have easy access to them. You will not need to go inside Traefik container in order to get them.

services:
  traefik:
    command:
      ...
      - "--accesslog=true"
      - "--accesslog.filePath=/logs/access.log"
    volumes:
      ...
      - ./docker/data/traefik:c:/logs/

You will get logs for all requests that comes through Traefik to your containers. But, be aware, if you have some traffic inside your Docker network(e.g. requests to rendering host in Experience Editor mode) then it will be not visible for Traefik and will not be logged.

Sunday, October 16, 2022

Sitecore Search: Difference between “Where” and “Filter”?

 This is a copy of my blog post originally posted here to keep all things in one place.

Imagine a situation, when you need to filter search result items based on the presence of layout.

ISearchIndex selectedIndex = ContentSearchManager.GetIndex(Search.Configuration.IndexName);
using (IProviderSearchContext context = selectedIndex.CreateSearchContext())
{
    var query = context
        .GetQueryable<SomeSearchResultItem>();
    
    //Should you use "where"?
    query = query.Where(i => i.HasLayout);
    //Or should you use "filter"?
    query = query.Filter(i => i.HasLayout);
}

Both methods will work. Usage of Where will give you only items with a layout. And usage of Filter will give you only items with a layout. But why does Sitecore have 2 APIs that do the same?

Indeed they are similar, but they are not the same. If we look under the hood for Solr queries that we get then we will see:

The difference between q and fq parameters is that q is used for relevance calculation and fq is not used. That is why it is a little bit better to use a Filter for query conditions that don't influence relevance. Also, fq relies on filterCache, which makes it faster compared to q.

You should not expect that replace of q to fq will make a huge performance boost. Most probably, you will not notice the difference. But if you can write more optimized code - do it! Always use Filter instead of Where, when it is possible.

Tuesday, October 11, 2022

Sitecore Processors and Dependency Injection

 This is a copy of my blog post originally posted here to keep all things in one place.

All current projects use dependency injection(DI). It gives you a lot of benefits:

  • It decreases coupling between classes and their dependencies.
  • It increases the testability of code. It is much easier to test code without dependencies.
  • It increases maintainability. If required, you may rewrite just one implementation without touching the implementations of all consumers.
  • It increases reusability. The implementation could be used in different places.
  • It allows concurrent development.

I haven’t seen for many years Sitecore projects without DI. Everyone uses DI.


Sitecore allows the usage of DI inside processors. All that you need, is to add resolve="true" to your processor configuration. But there is one not-obvious thing. The default lifetime of Sitecore processors is Singleton. It may cause an issue.

For example, you have a processor with dependency:

public class TestProcessor 
{
    private IDependency _dependency;
    public TestProcessor(IDependency dependency)
    {
        _dependency = dependency;
    }
    public void Process()
    {
        //usage of _dependency
    }
}
<processor type="YourNamespaceTestProcessor, YourAssembly" resolve="true" />

Dependency has a Transient lifetime.

[Service(typeof(IDependency), Lifetime = Lifetime.Transient)]
public class Dependency : IDependency
{
}

public interface IDependency
{
}

What lifetime will _dependency have inside TestProcessor? The answer is not obvious, it will have Singleton lifetime. It happens because the default lifetime for Sitecore processors is Singleton. It makes sense for performance optimization. You don’t want to construct new objects if you can use the same ones. That is why your Transient configuration will not matter. And you will get “cached” _dependency from your Singleton TestProcessor.

There are 2 options, for how you can use a different lifetime of dependencies inside your process.

The first is the usage of ServiceLocator. You may modify your processor in this way.

public class TestProcessor 
{
    public TestProcessor()
    {
    }
    public void Process()
    {
        var dependency = ServiceLocator.ServiceProvider.GetService<IDependency>();
        //usage of _dependency
    }
}

In this case, you will get dependency that is not cached by the lifetime of the processor. But usually, usage of ServiceLocator is a bad practice.

The second option is the usage of a not-well-documented reusable attribute in your processor configuration.

<processor type="YourNamespaceTestProcessor, YourAssembly" resolve="true" reusable="false" />

reusable attribute has a default value true and is responsible for switching processor scope from Processor to Invocation.

private static ProcessorObject GetObjectFromType(XmlNode processorNode)
{
	string attribute = XmlUtil.GetAttribute("reusable", processorNode, "true");
	ObjectScope scope = ((attribute == "true") ? ObjectScope.Processor : ObjectScope.Invocation);
	object obj = Factory.CreateObject(processorNode, assert: true);
	return new ProcessorObject(obj, scope);
}

Conclusion

Be careful, when you are working with dependency injection in Sitecore processors, and remember about their default lifetime.

Monday, September 12, 2022

Validate Your Sitecore Serialization Using Pre-commit Git Hook

 This is a copy of my blog post originally posted here to keep all things in one place.

How often do you push broken Sitecore serialization with your commits? If the answer is "never" then I envy you, you are a very neat developer! Then how often does someone in your team push broken serialization? I don’t believe that on second question answer will be "never". Depending on the size of the project and the intensity of work, it will definitely happen from time to time. Let’s figure out how to prevent it.

Git has the ability to add hooks. Hooks are programs you can place in a hooks directory to trigger actions at certain points in git’s execution. There are many of points, where we are able to include our programs(scripts): applypatch-msgpre-applypatchpost-applypatchpre-commitpre-merge-commitprepare-commit-msgcommit-msgpost-commitpre-rebasepost-checkoutpost-mergepre-pushpre-receiveupdateproc-receivepost-receivepost-updatereference-transactionpush-to-checkoutpre-auto-gcpost-rewritesendemail-validatefsmonitor-watchmanp4-changelistp4-prepare-changelistp4-post-changelistp4-pre-submitpost-index-change. Seeing this big list of hooks you may understand, that it is possible to add your custom logic only everywhere in the Git execution process. It is like events or pipelines in Sitecore: places, where you can extend existing logic according to your needs. Despite of big list of hooks, they are not too popular. The major part of projects will have either no Git hooks, or you may have hooks that run linters or force you to follow a certain commit message format.

Recent Sitecore versions provide powerful Sitecore CLI. This CLI includes work with serialization. And we are interested in the validation of serialization. Now, in order to check if Sitecore serialization saved on disk is valid, you don’t even need Sitecore runtime. You can do it by running one command dotnet sitecore ser validate. Let’s add it to Git pre-commit hook to avoid our team members pushing broken serialization to git.

  1. You need to download this Gist.
#!/bin/sh
# Pre-commit Git hook
# It runs Sitecore CLI Serialization check
# And doesn't allow to perform commit if serialization is broken
validate=$(dotnet sitecore ser validate)
regex_errors="Errors were detected"
count=$(echo "${validate}" | grep -c "${regex_errors}")
if test $count -gt 0
then
	echo "Sitecore serialization errors were detected"
	echo "Please run 'dotnet sitecore ser validate'"
	echo "And fix all errors before commit"
	exit 1
else	
	exit 0
fi
  1. Then you need to put it into .git\hooks directory with name pre-commit
  2. Now, before making a new commit, serialization validation will be executed. And if something is wrong with serialization, you will not be able to make a commit. You will get an error message:

Git Hook in Action

After fixing serialization issues, you should be able to move forward. And now you may be confident that no one in your team will be able to push broken serialization and block someone else’s work.

Git hook will be a good option until you don’t have a huge amount of serialized items. It will work fine until running dotnet sitecore ser validate is fast. But if it will start to take more than a few seconds it may start to annoy developers. What you can do in that case? You will need to incorporate validation into your CI pipelines. You may run it on each pull request to make sure that no one will be able to merge broken serialization to the main branch.

Tuesday, September 6, 2022

Covering Sitecore Dianoga Module with Integration Tests

 This is a copy of my blog post originally posted here to keep all things in one place.

 Dianoga grew over time. There were added different image formats, different strategies, logging, additional settings like path exclusion, etc. And all these things are configurable. You can turn them on and off and achieve the behavior that you want. In 2022, there are 15 configuration files. I decided to add new file format support, but the number of different configurations scared me. How to test all of them and be sure that everything works? How quickly reproduce the reported issue?

The answer is automated testing. One of the most valuable things in covering your code with tests is that you are not afraid to change it.Dianoga has already some unit test coverage.

But as Dianoga modifies Sitecore behavior, even 100% unit tests code coverage doesn’t guarantee that everything every time will work. It could be checked with integration tests. Integration tests require running Sitecore. We don’t want to have an infrastructure for it. Fortunately, we can easily run Sitecore in Docker containers. The only one thing is required: quick and easy ability to add Dianoga module to your Sitecore container. And that was the one of reasons for the creation of Dianoga Asset Image.

How does it work:

  1. Integration tests are located in the integration-tests folder of Dianoga sources.
  2. We have different docker-compose configurations: for sync mode, for async mode, with enabled SVG, with enabled SVG and WebP, with enabled SVG/WebP/avif/jpegxl.

visual studio code: docker-compose.yml

  1. You can easily add a new configuration if you need to run a specific test to reproduce some issue
  2. We have a few test pages with a number of images on them.
  3. We have test container. It runs .net core tests project. This project makes requests to Sitecore containers and verifies that Dianoga module squeezes images as expected.

visual studio: integration tests project

  1. We have Powershell script run-tests.ps1 that runs Docker configurations one by one and gather test results.
  2. All test results are saved to integration-tests\docker\data\tests folder

Sample results output

powershell: tests output

Conclusion

Running all these tests takes some time. But it saves a huge amount of time when you made some changes in your code and you want to make sure that all configurations still work as expected! Also, it become much easier to troubleshoot reported issues. You are able to set up a new Docker configuration and run a test to reproduce the issue. And as a bonus, you get examples, of how to configure Dianoga with different image formats and different strategies for your containerized environment.