This is a copy of my blog post originally posted here to keep all things in one place.
Containerization and division of monolith to services bring many good things. For example, it makes your system distributed, which decreases coupling and makes your architecture more scalable. But some things become more complex. It is harder to monitor, debug, and trace distributed systems. There are many different systems to address this challenge: Prometheus, New Relic, Jaeger, etc. I decided to try New Relic. I had some experience with it in a non-containerized environment and I liked it. It has plenty of agents for different services. It has a free plan that allows playing with it even locally for free. But it isn’t necessarily the best choice. If you want to know why read this article to the end.
An example I will take Sitecore 10.2 that consists of the next services: CM(CD), Next.js rendering host, Identity Server, Horizon, MS SQL, and Solr.
CM/CD
Enabling New Relic monitoring for CM/CD containers is the most straightforward.
You will need to modify your Dockerfile:
# Download the New Relic .NET agent installer
RUN [Net.ServicePointManager]::SecurityProtocol = [Net.SecurityProtocolType]::Tls12;`
 Invoke-WebRequest "https://download.newrelic.com/dot_net_agent/latest_release/NewRelicDotNetAgent_x64.msi"`
 -UseBasicParsing -OutFile "NewRelicDotNetAgent_x64.msi"

# Install the New Relic .NET agent
RUN Start-Process -Wait -FilePath msiexec -ArgumentList /i, "NewRelicDotNetAgent_x64.msi", /qn

# Remove the New Relic .NET agent installer
RUN Remove-Item "NewRelicDotNetAgent_x64.msi"
And pass the environment variable in your docker-compose.yml:
cm:
    ...
    environment:
      NEW_RELIC_APP_NAME: CM
      NEW_RELIC_LICENSE_KEY: ${NEW_RELIC_LICENSE_KEY}
      NEW_RELIC_ENABLED: ${NEW_RELIC_ENABLED}
It is quite convenient that New Relic has the ability to enable/disable monitoring using an environment variable. You can have the New Relic configuration present in your source control and enable it only when you need it.
Next.js Rendering Host
Next.js server runs by Node.js. We need to install New Relic NPM packages:
npm install newrelic @newrelic/nextand add @newrelic/next middleware using Node.js -r option to docker-compose.yml:
rendering:
    ...
    environment:
      NODE_OPTIONS: "-r @newrelic/next"
      NEW_RELIC_APP_NAME: "Rendering Host - Next.js"
      NEW_RELIC_LICENSE_KEY: ${NEW_RELIC_LICENSE_KEY}
      NEW_RELIC_ENABLED: ${NEW_RELIC_ENABLED}
If you will host your Next.js on Vercel, it will be even more simple. You will get monitoring in place in just a few clicks by connecting one SaaS to another.
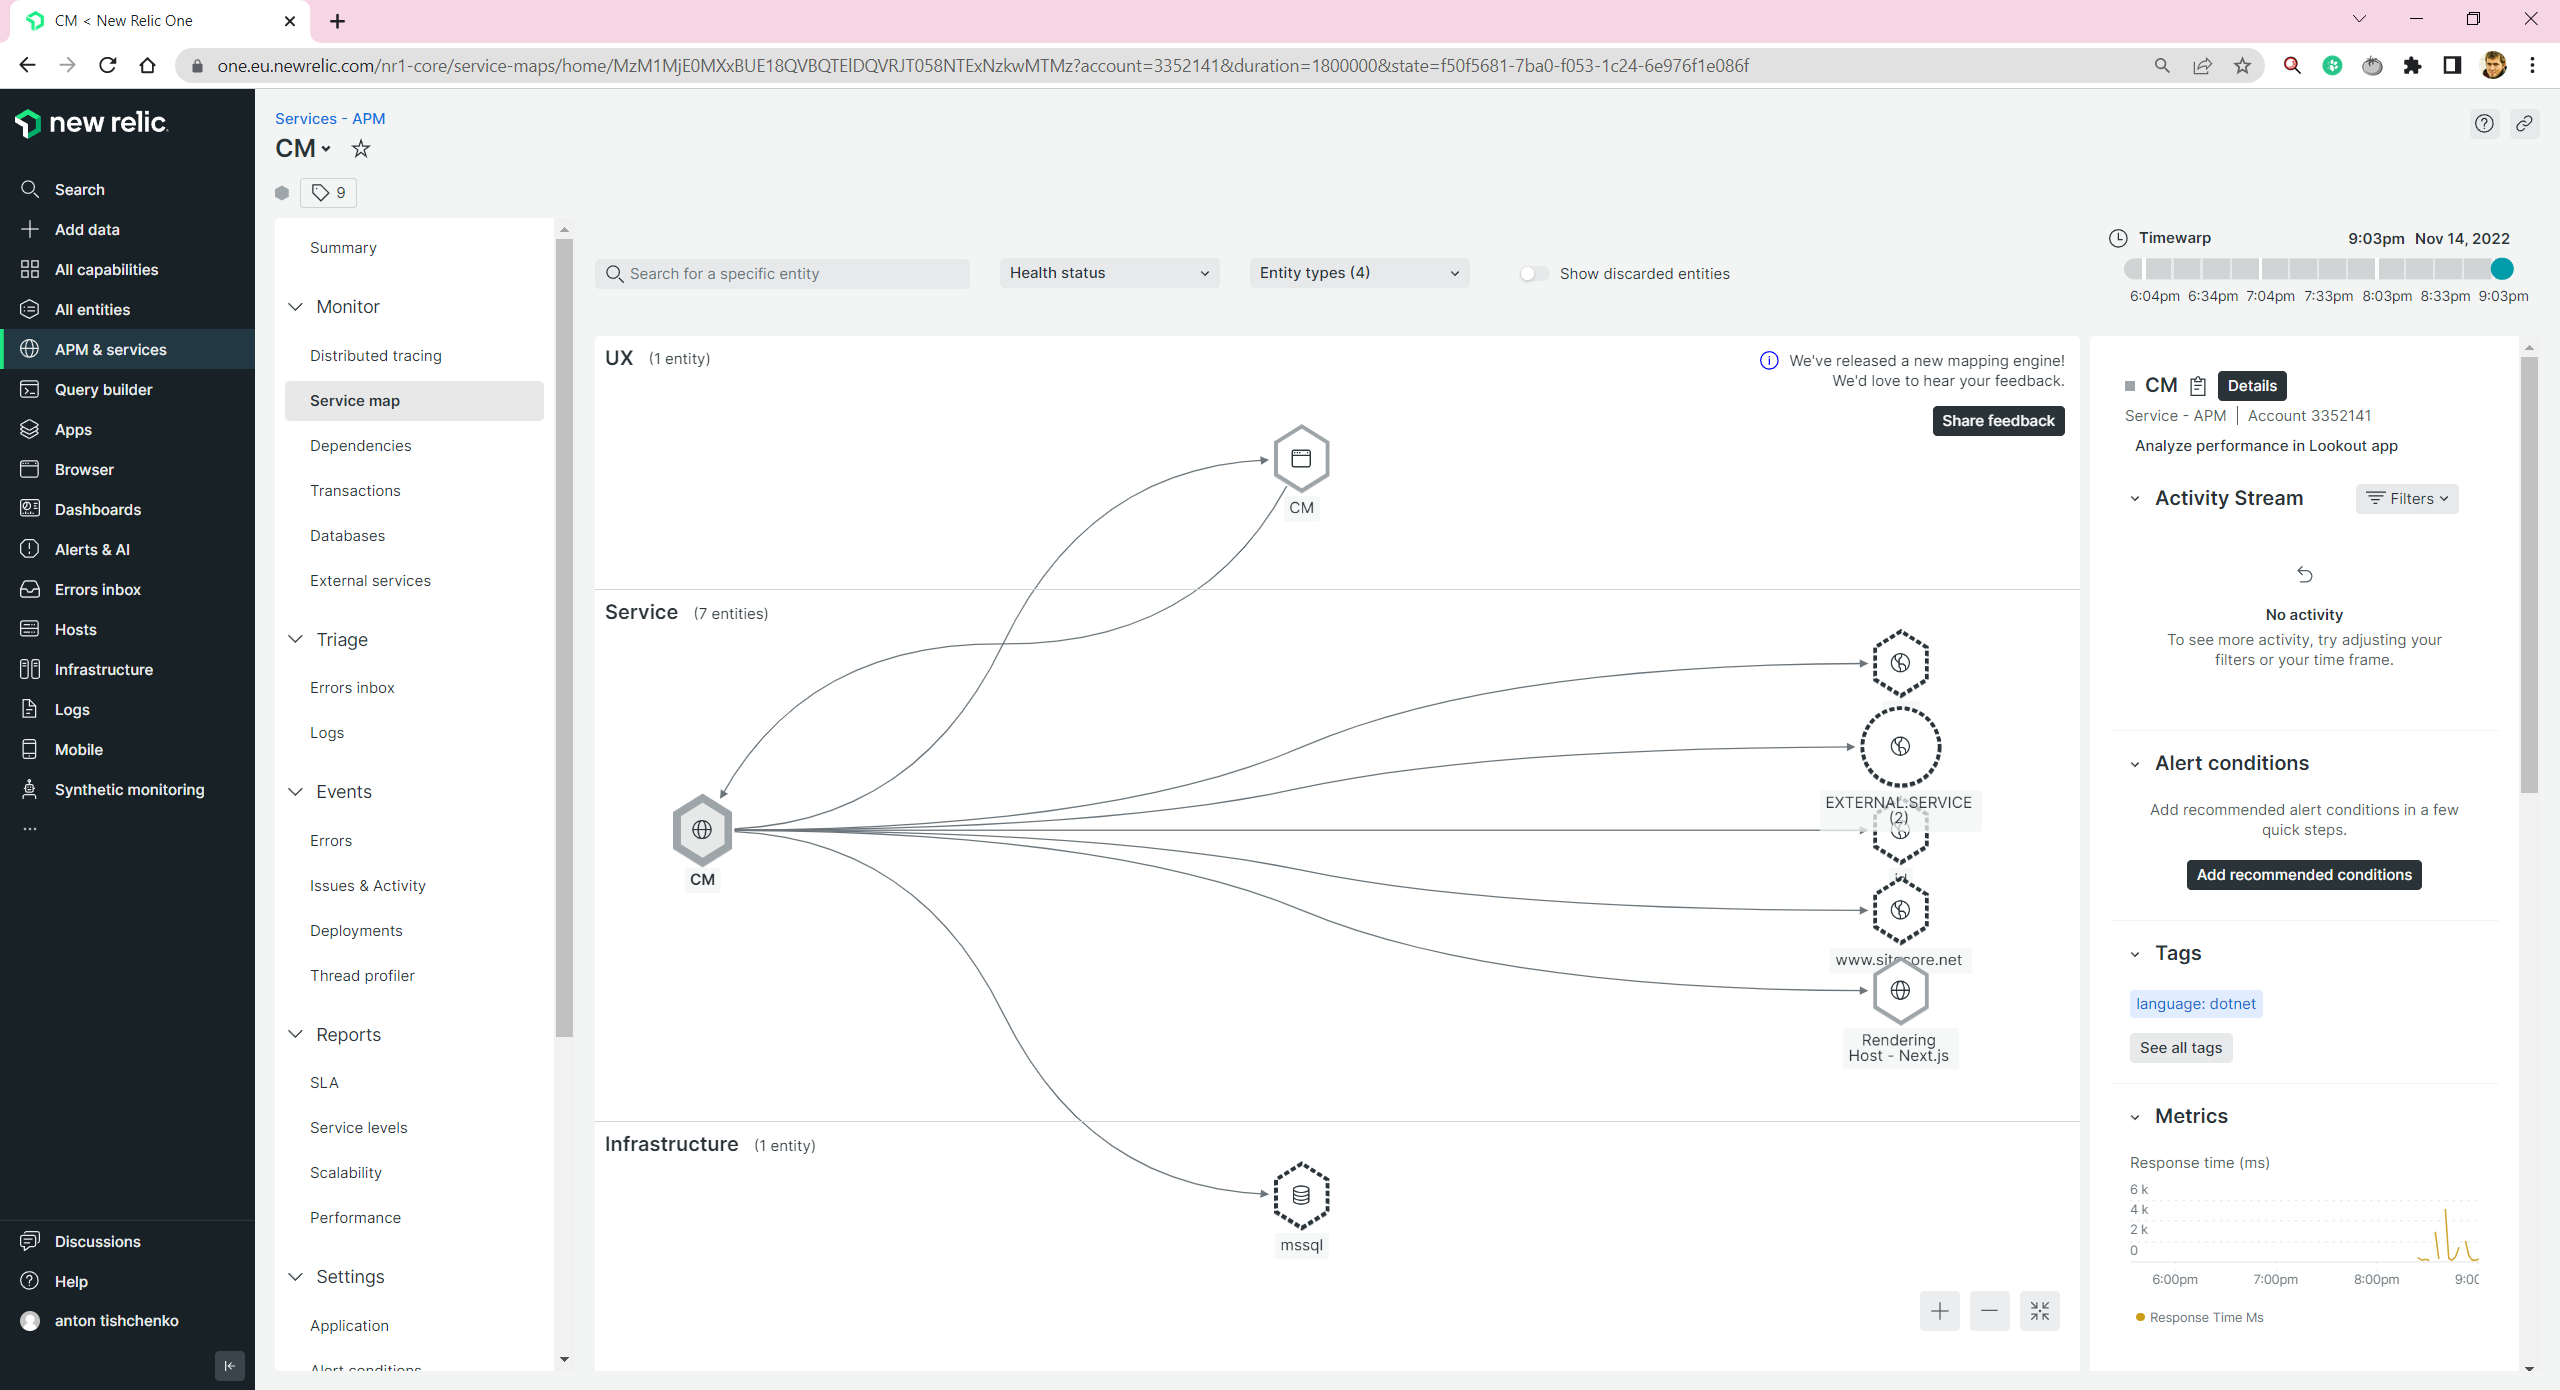
Let’s check what we get. We have a nice service map. We can see what depends on what.
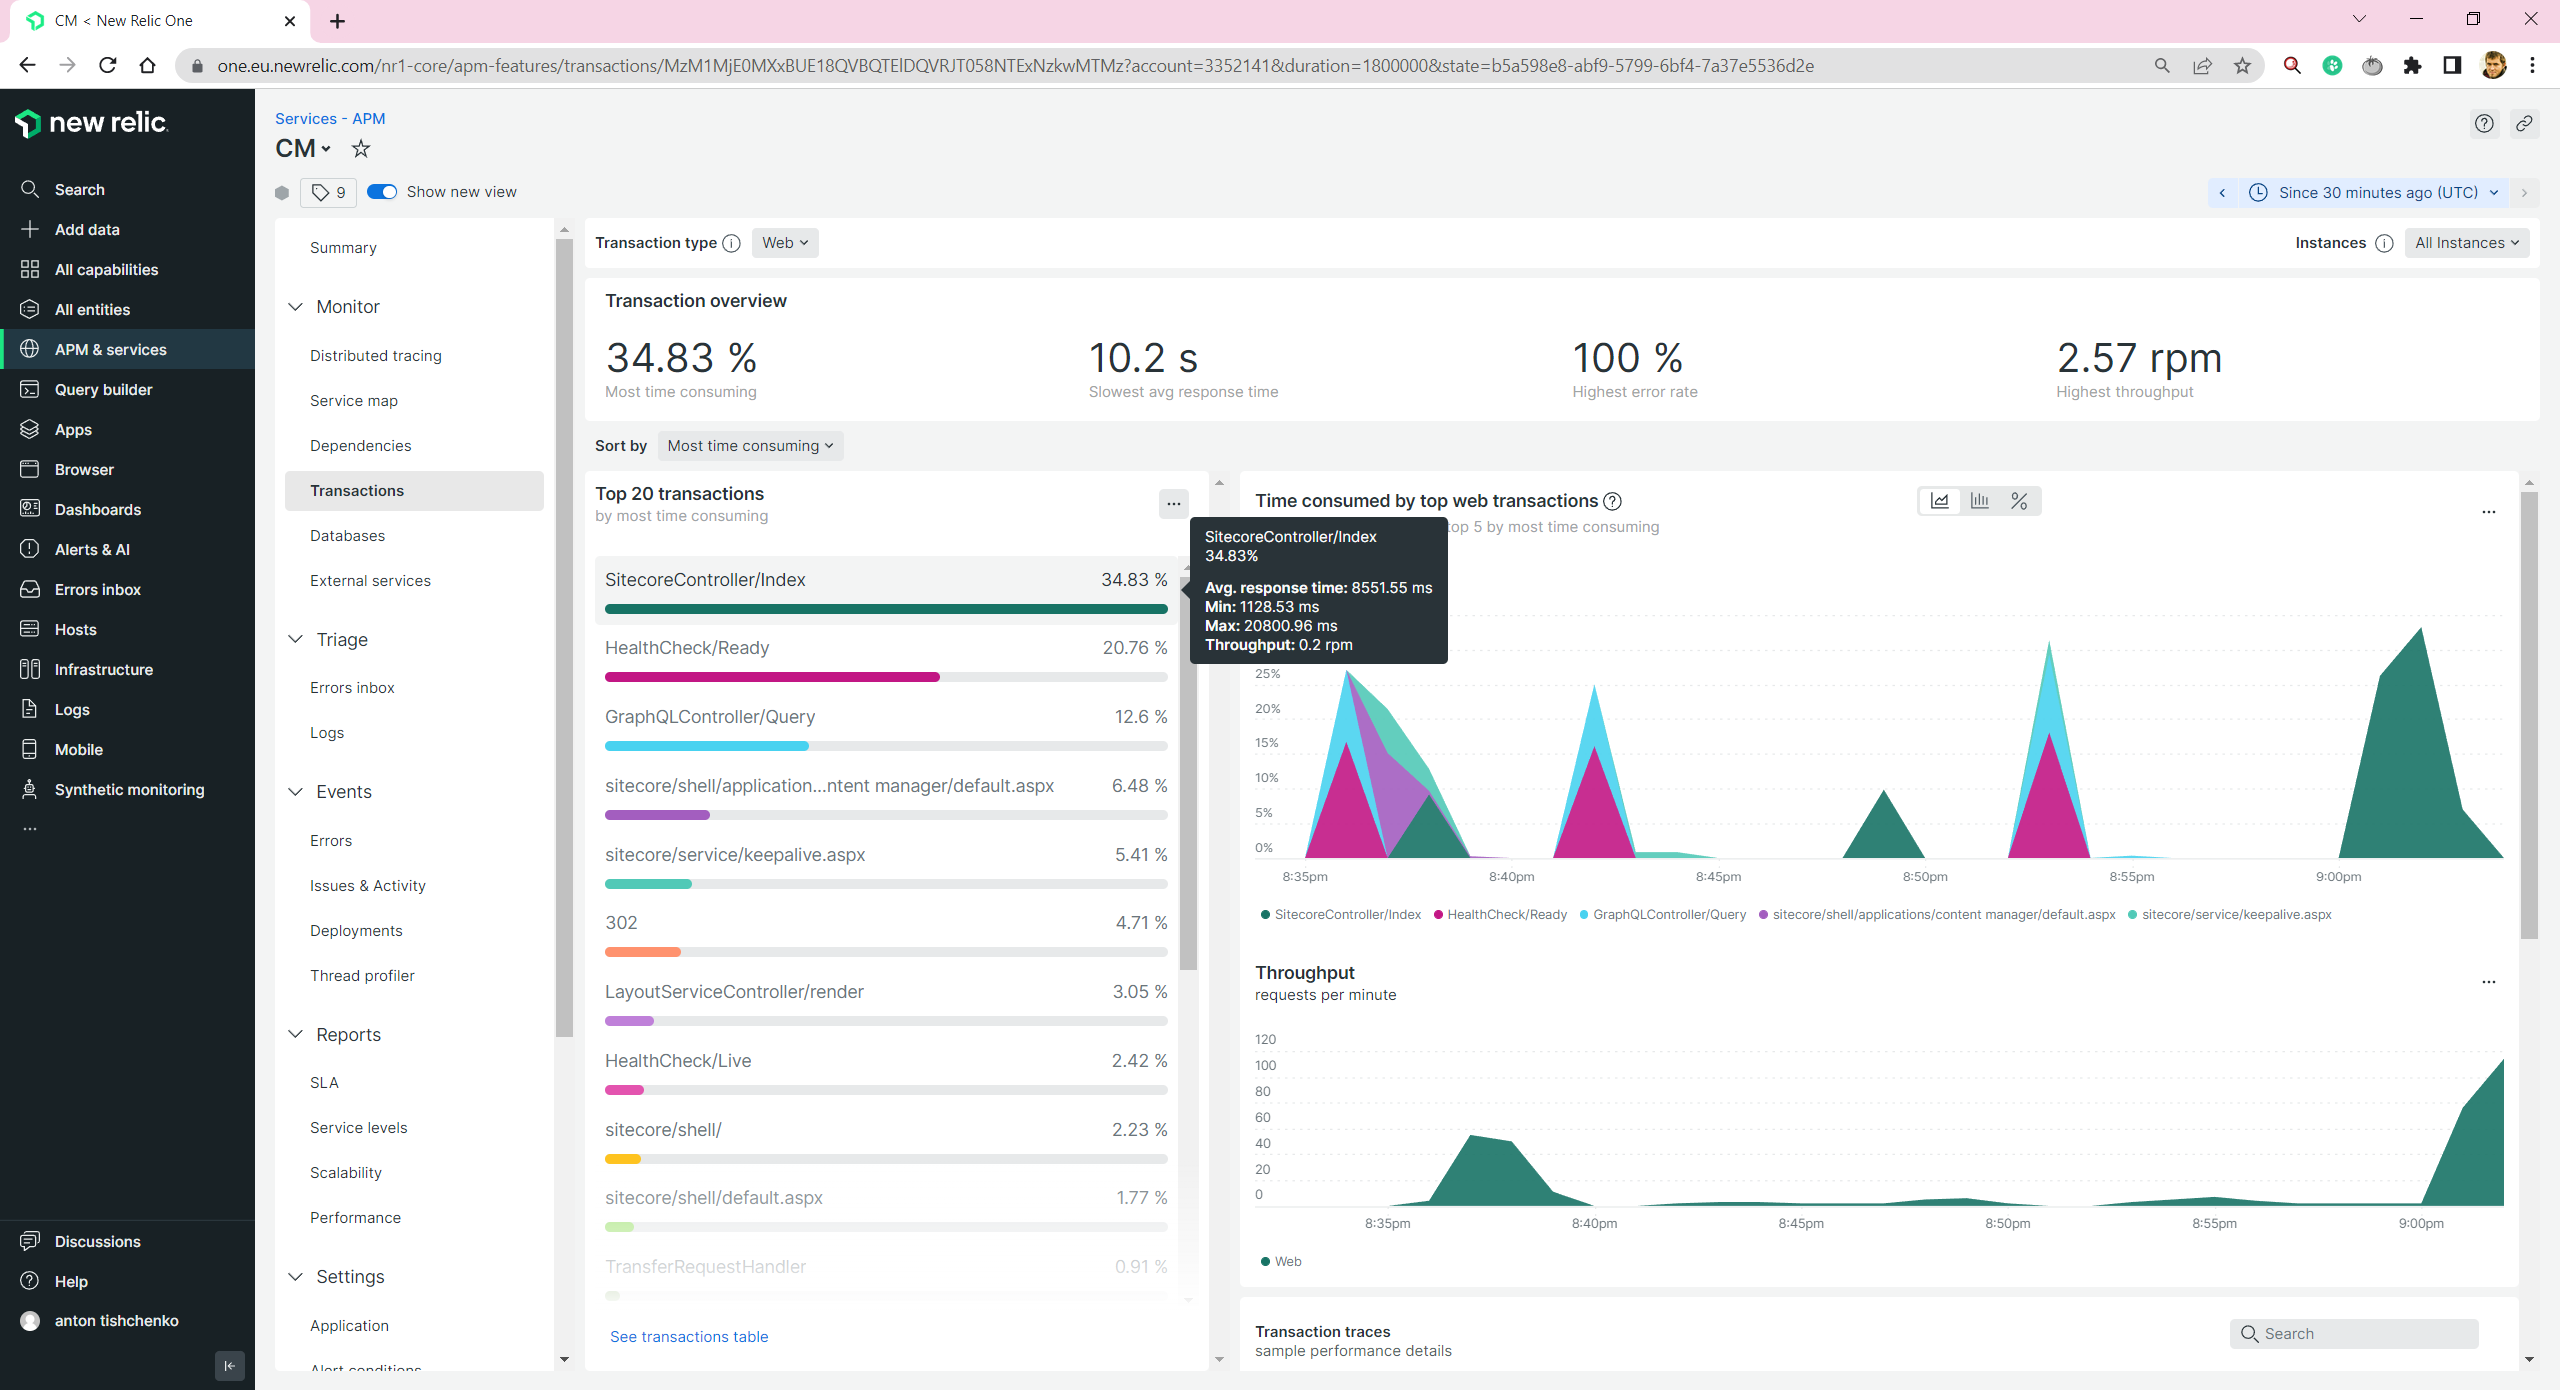
We are able to see all transactions for CM/CD/Next.js Rendering Host
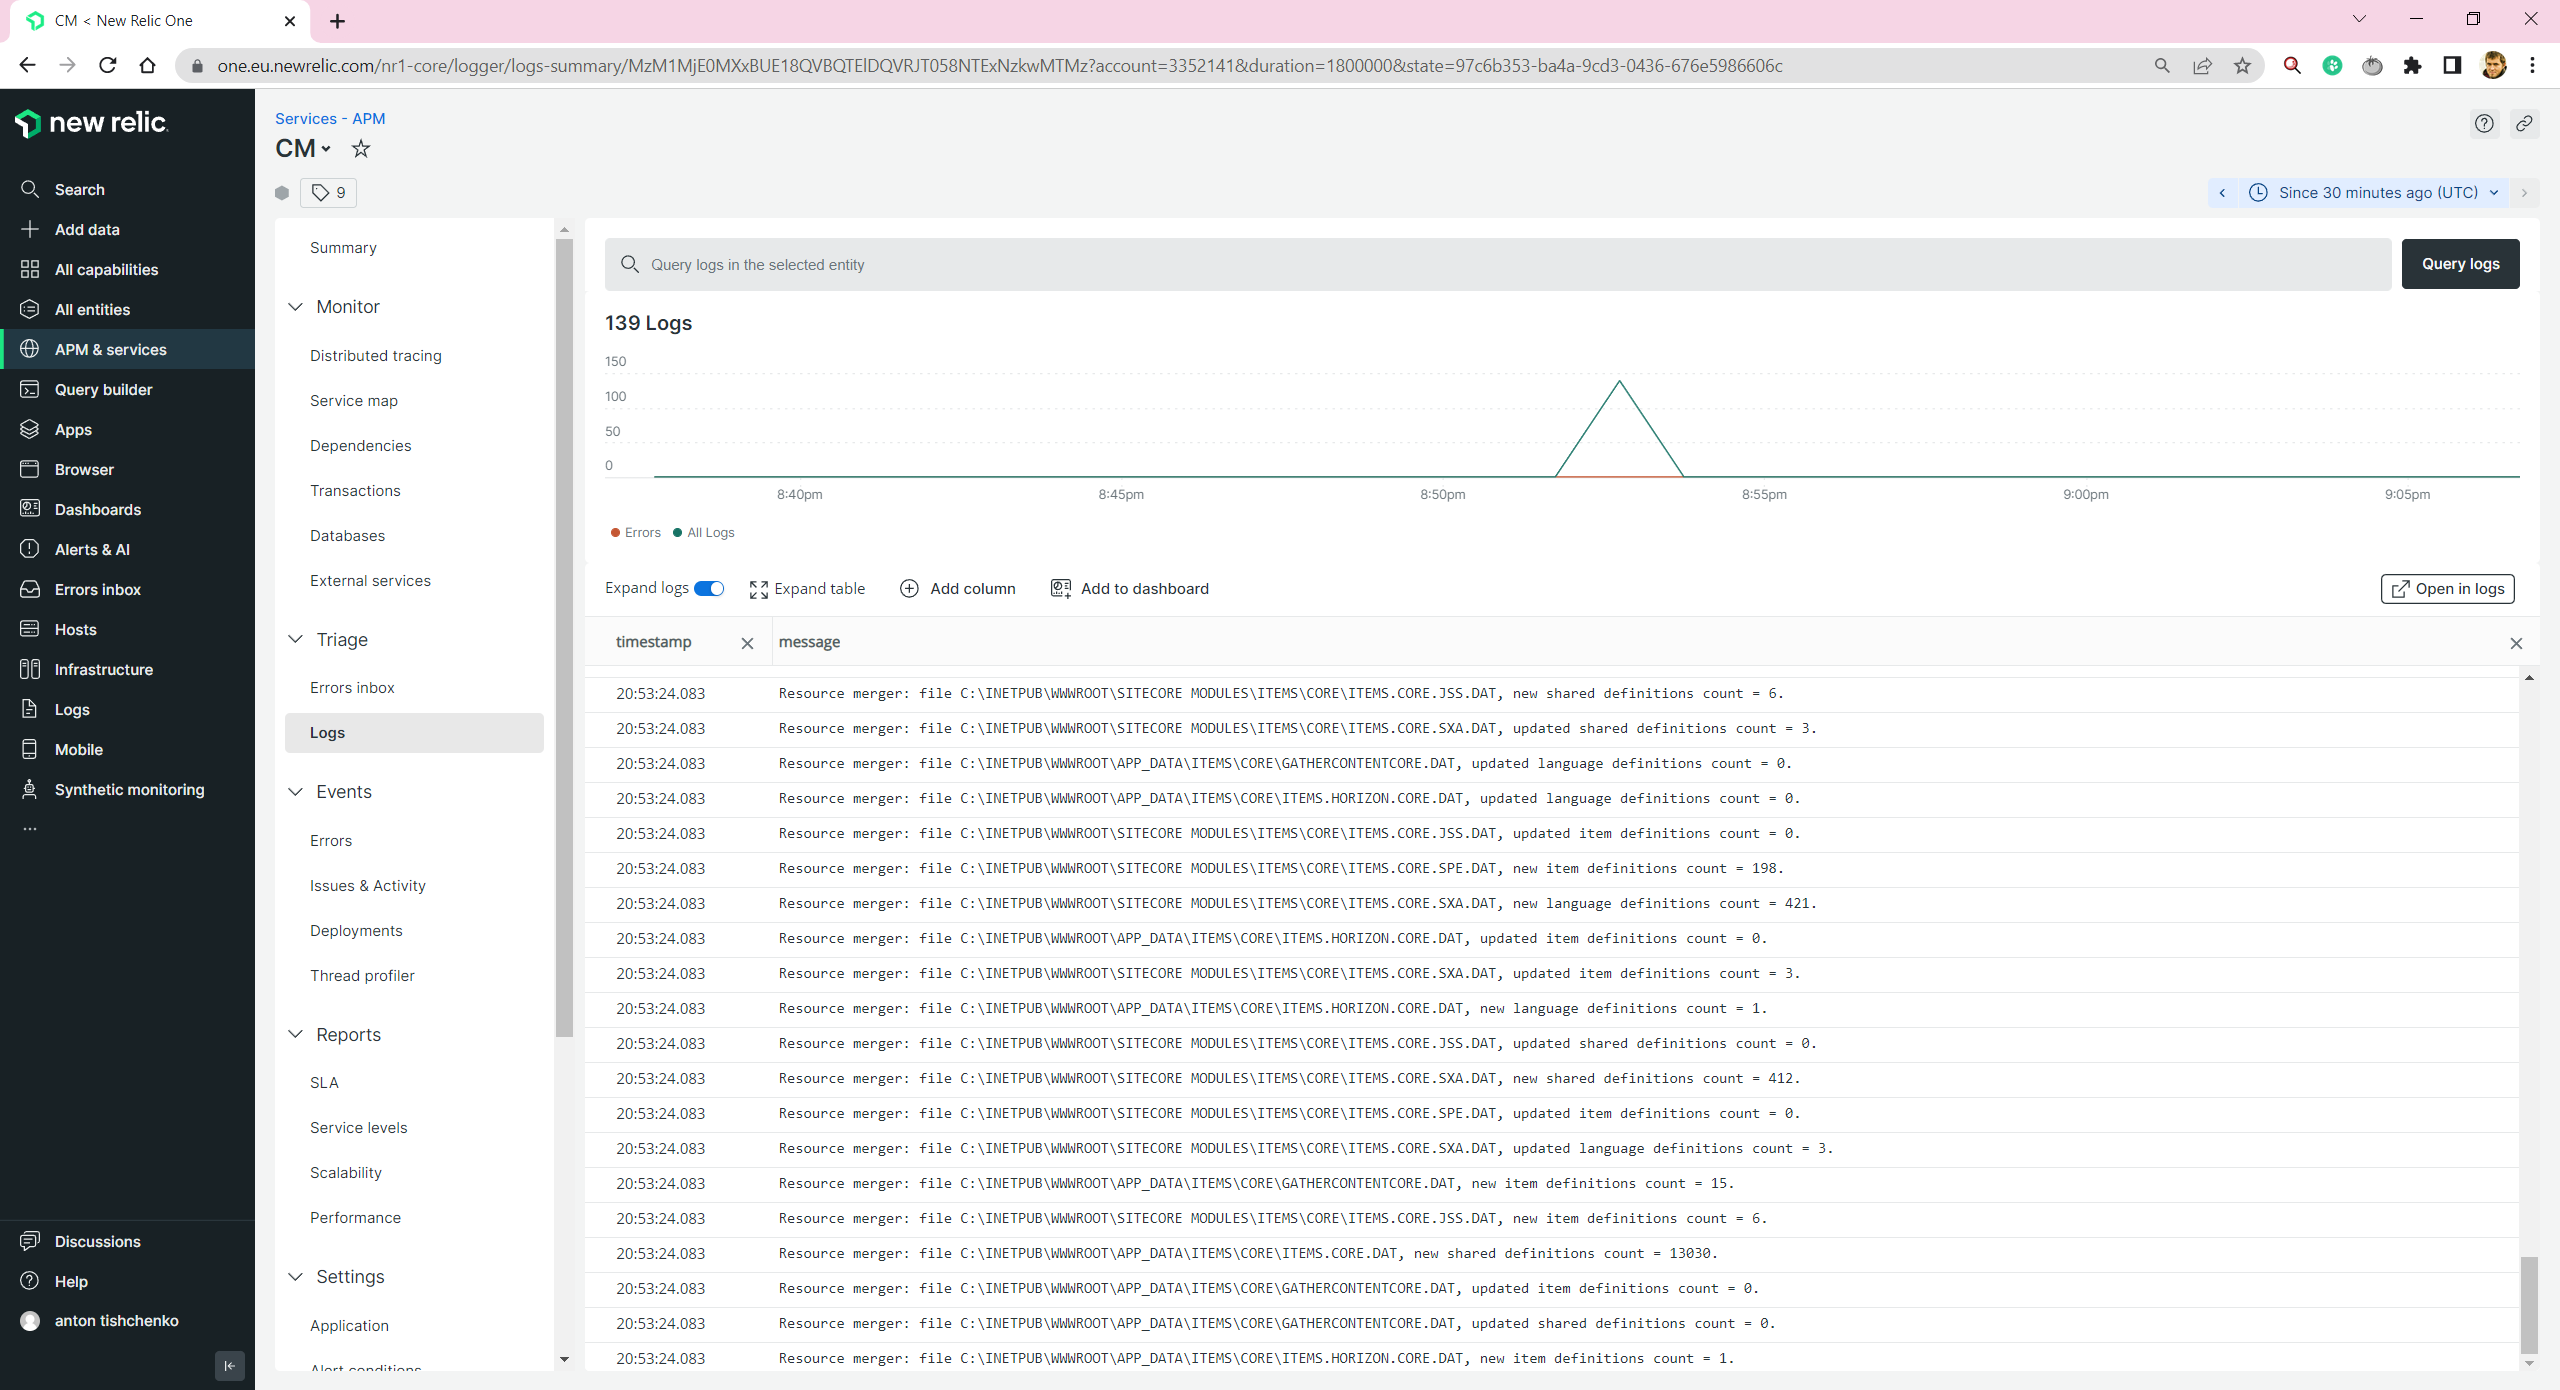
We are able to see Sitecore and Next.js logs:
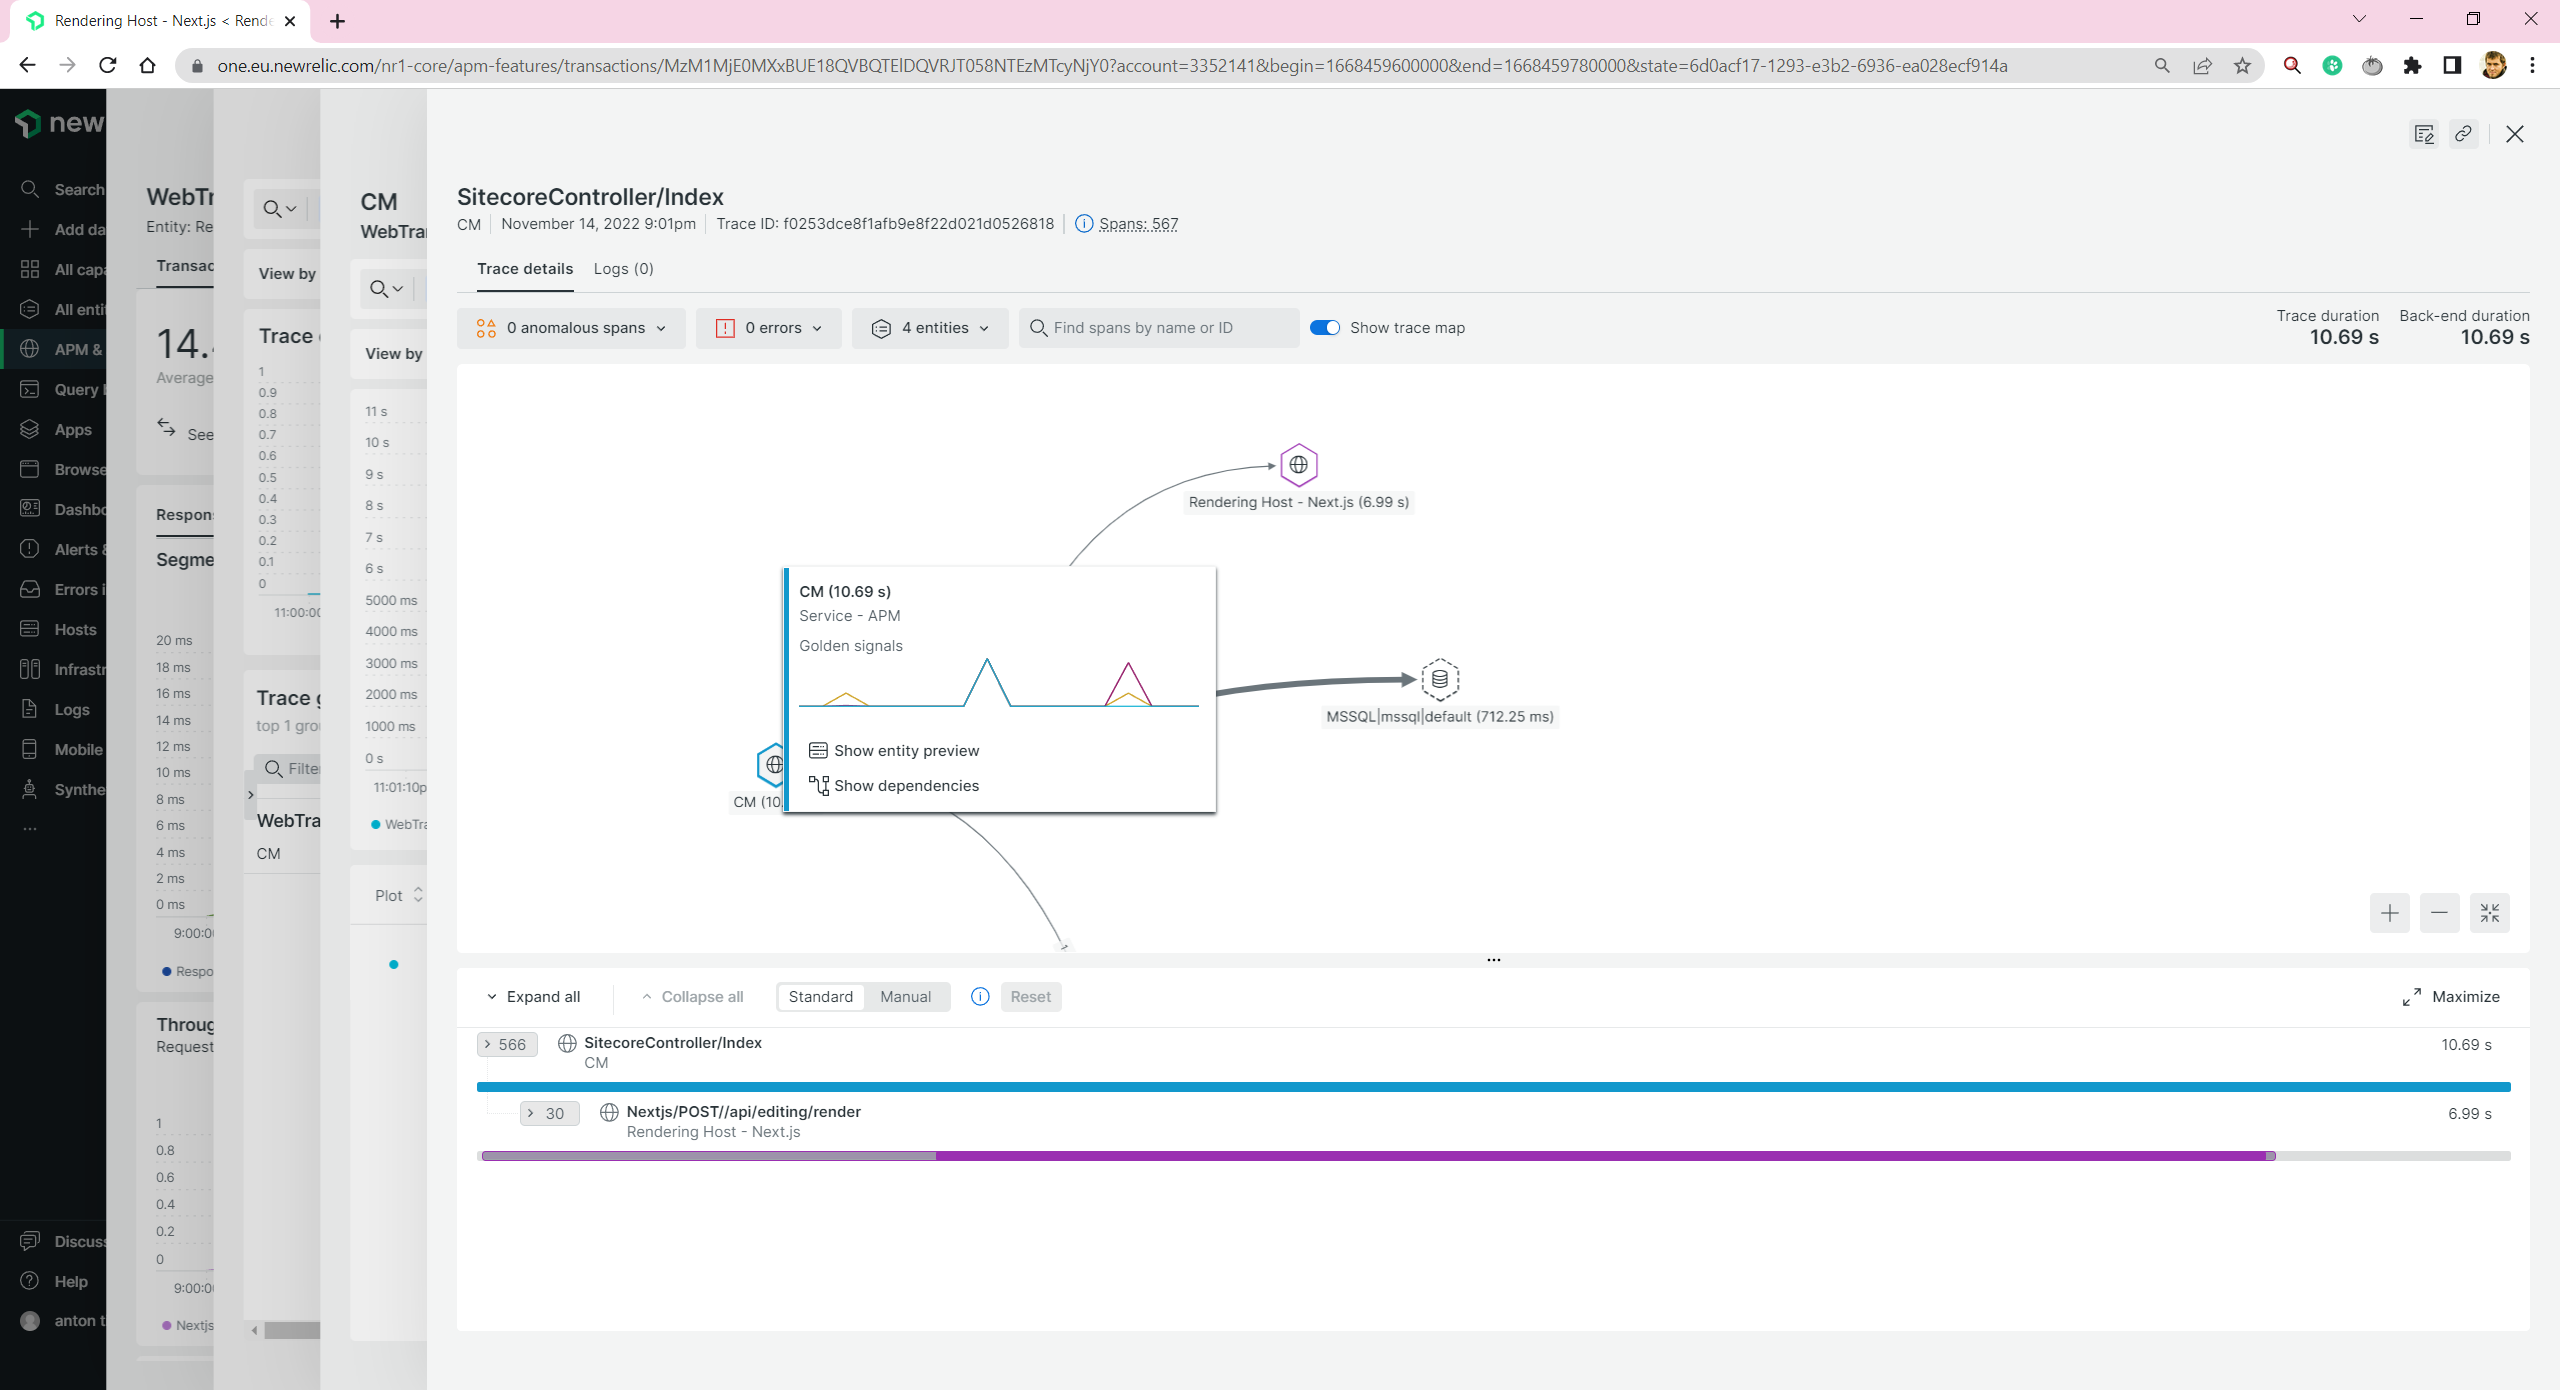
And we are able to trace distributed transactions. E.g. for Experience Editor, when both CM and Next.js rendering host take part:
Let’s go further and try to add monitoring to other services.
Identity Server and Horizon
Here I get the first problem. Sitecore Docker images for Identity Server and Horizon are based on Nano Server. And New Relic doesn’t support it. It is not a big deal. These services are not the most loaded. And monitoring them is not essential. If you need to monitor them then it still should be possible. You need to build your own containers based on Server Core or Windows base images. It is not very convenient, you will need to support these images, and rebuild during Sitecore upgrades, but still possible.
MS SQL
Here I get another problem. Sitecore Docker image should support it, I haven’t found anything in the requirements that don’t match. And I tried a few different methods of agent installation: guided(you need to run PowerShell scripts) and manual(you copy files and create a Windows service). But both cases failed, and I got a message unsupported. Is it a big deal? Most probably - not. For production environment you will host your databases either on Azure SQL Databases or on Amazon RDS. And these agents work just fine. But, unfortunately, no monitoring locally.
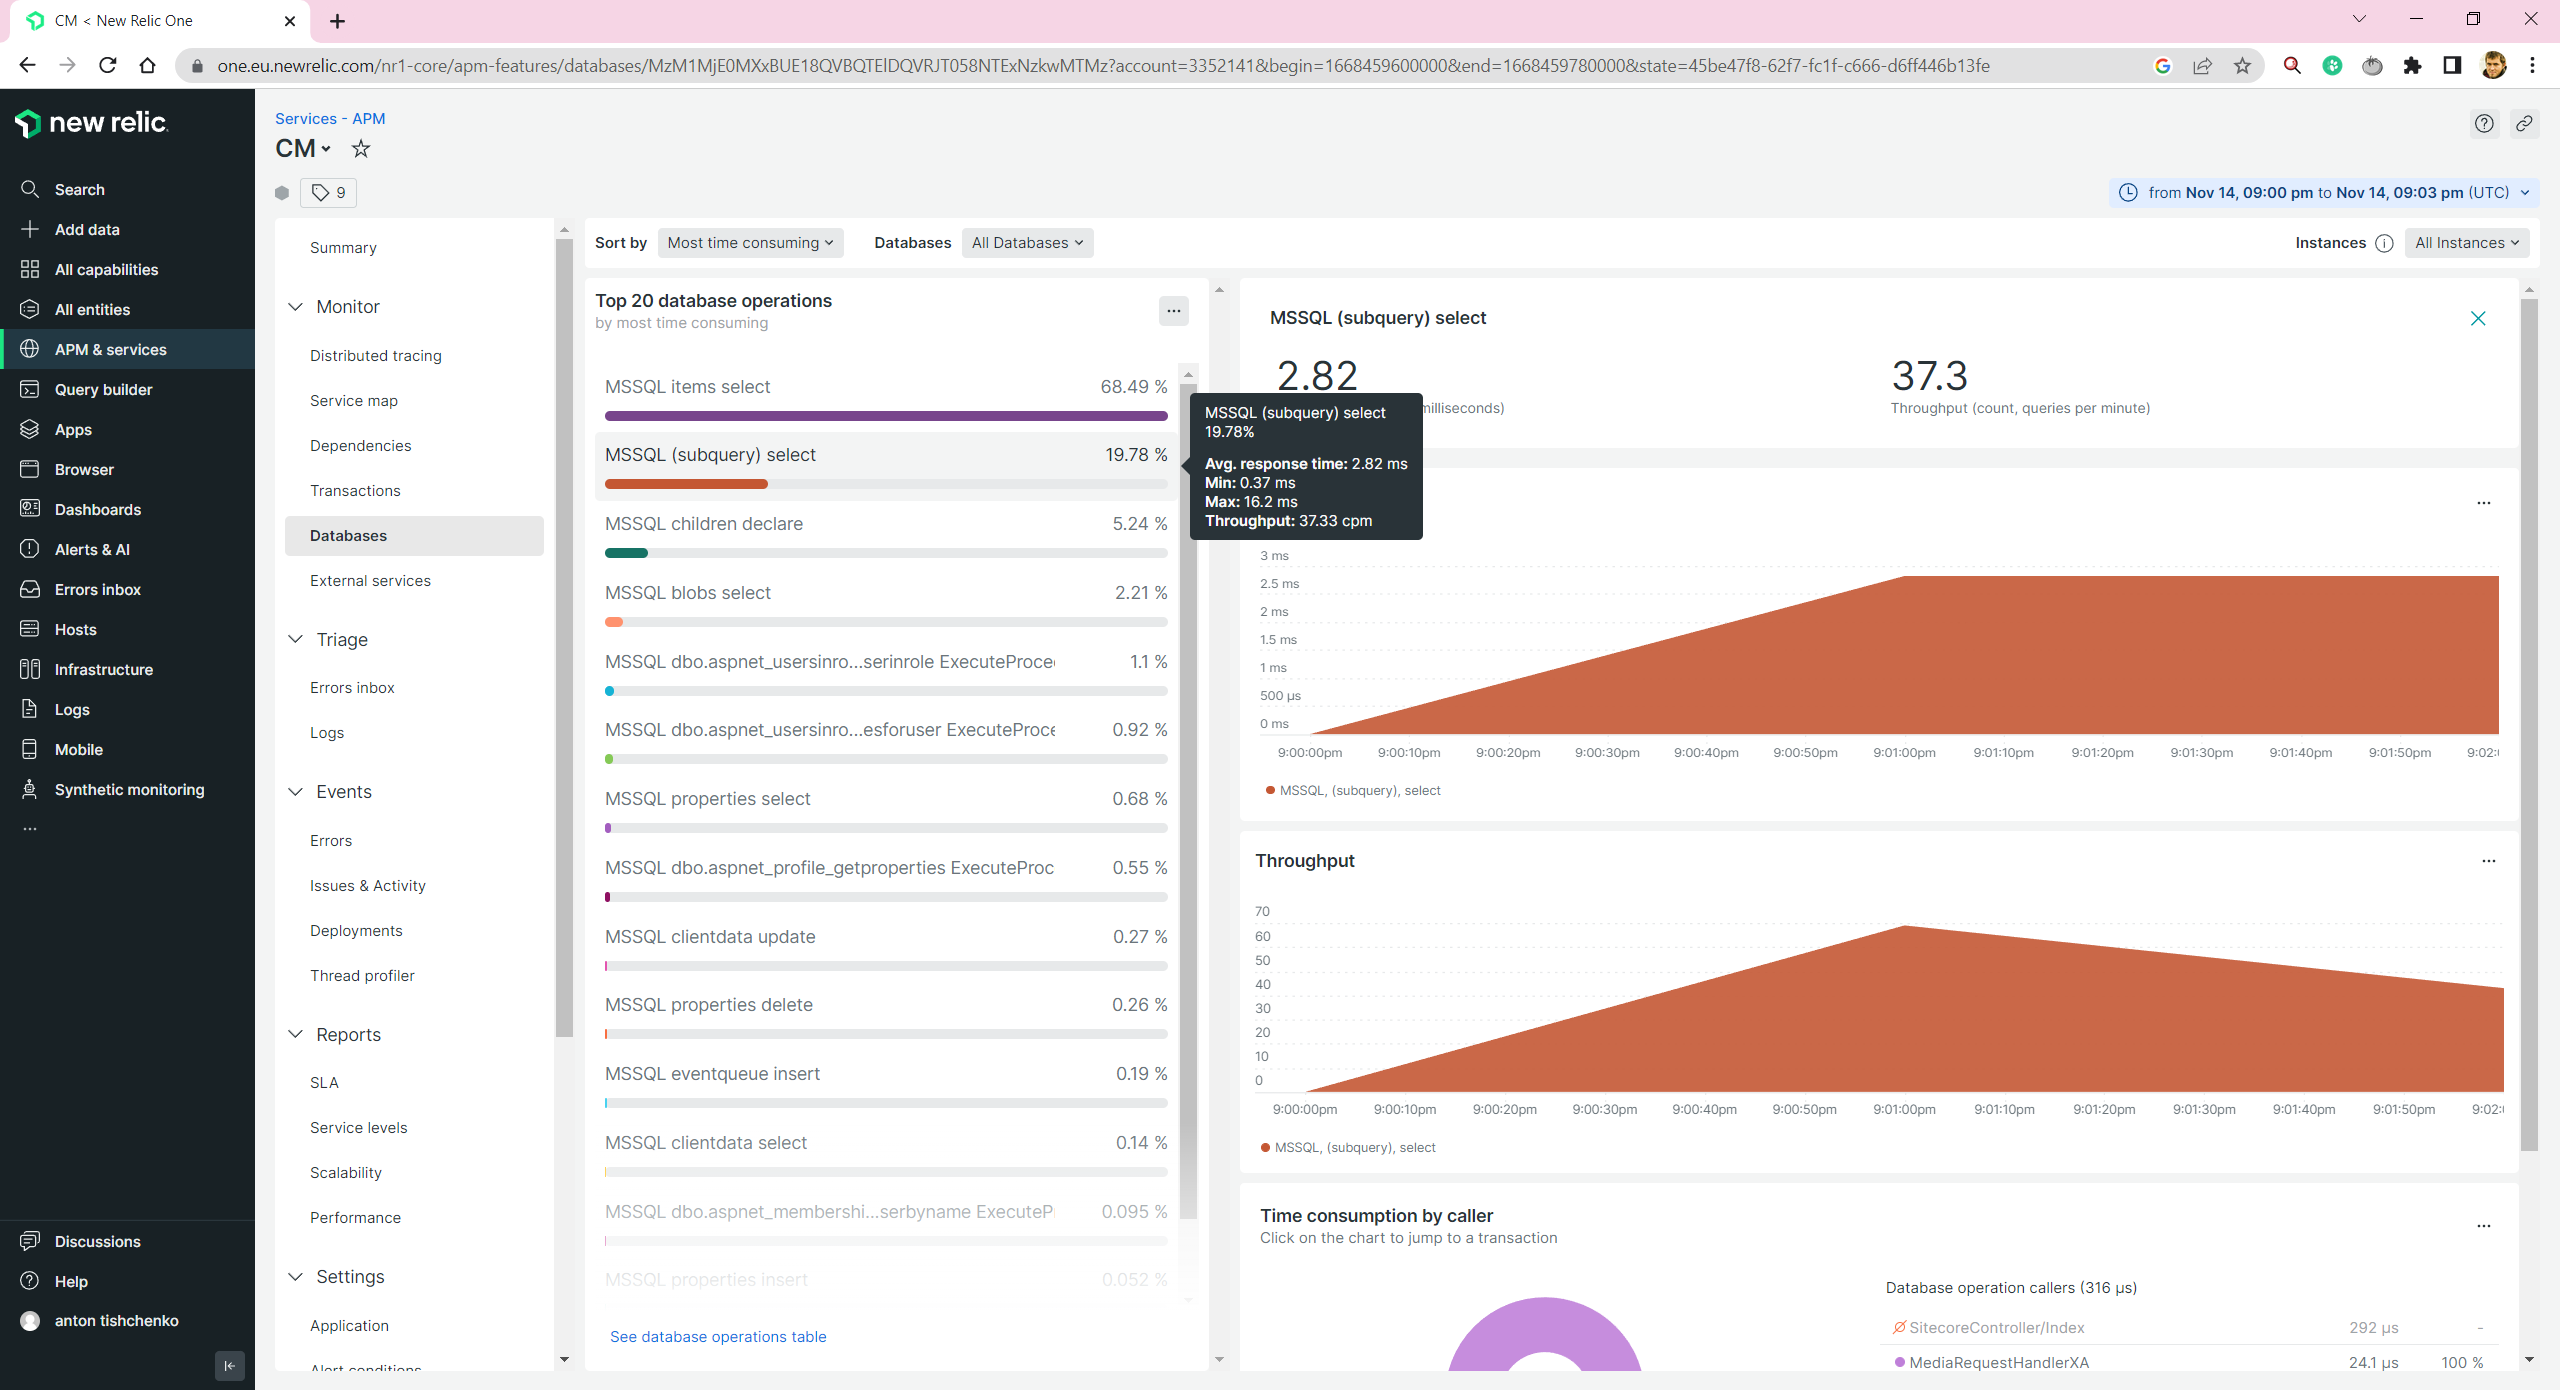
You still will be able to get some database insights by reviewing your CM/CD monitoring information. But they are not as detailed as they can be.
Solr
In fact, Solr is a Java server wrapper on Lucene. And as it is based on Java, we should follow Java instructions. We need to download and add into Solr image newrelic.jar, a Java-based New Relic agent, and modify solr.cmd to run Java with an agent -javaagent:newrelic.jar. And pass New Relic environment variables similar to other services.
Conclusion
Is New Relic a good tool for monitoring your Sitecore containers? Despite some difficulties with MS SQL, Horizon, and Identity server, I will answer - yes. You will be able to get New Relic monitoring for your major Sitecore services in place in one SCRUM team sprint. During the second sprint, you will be able to add some additional metrics. There is a worse situation with other free open-source competitors. You will get software for free, but you will spend more time configuring and supporting it.
